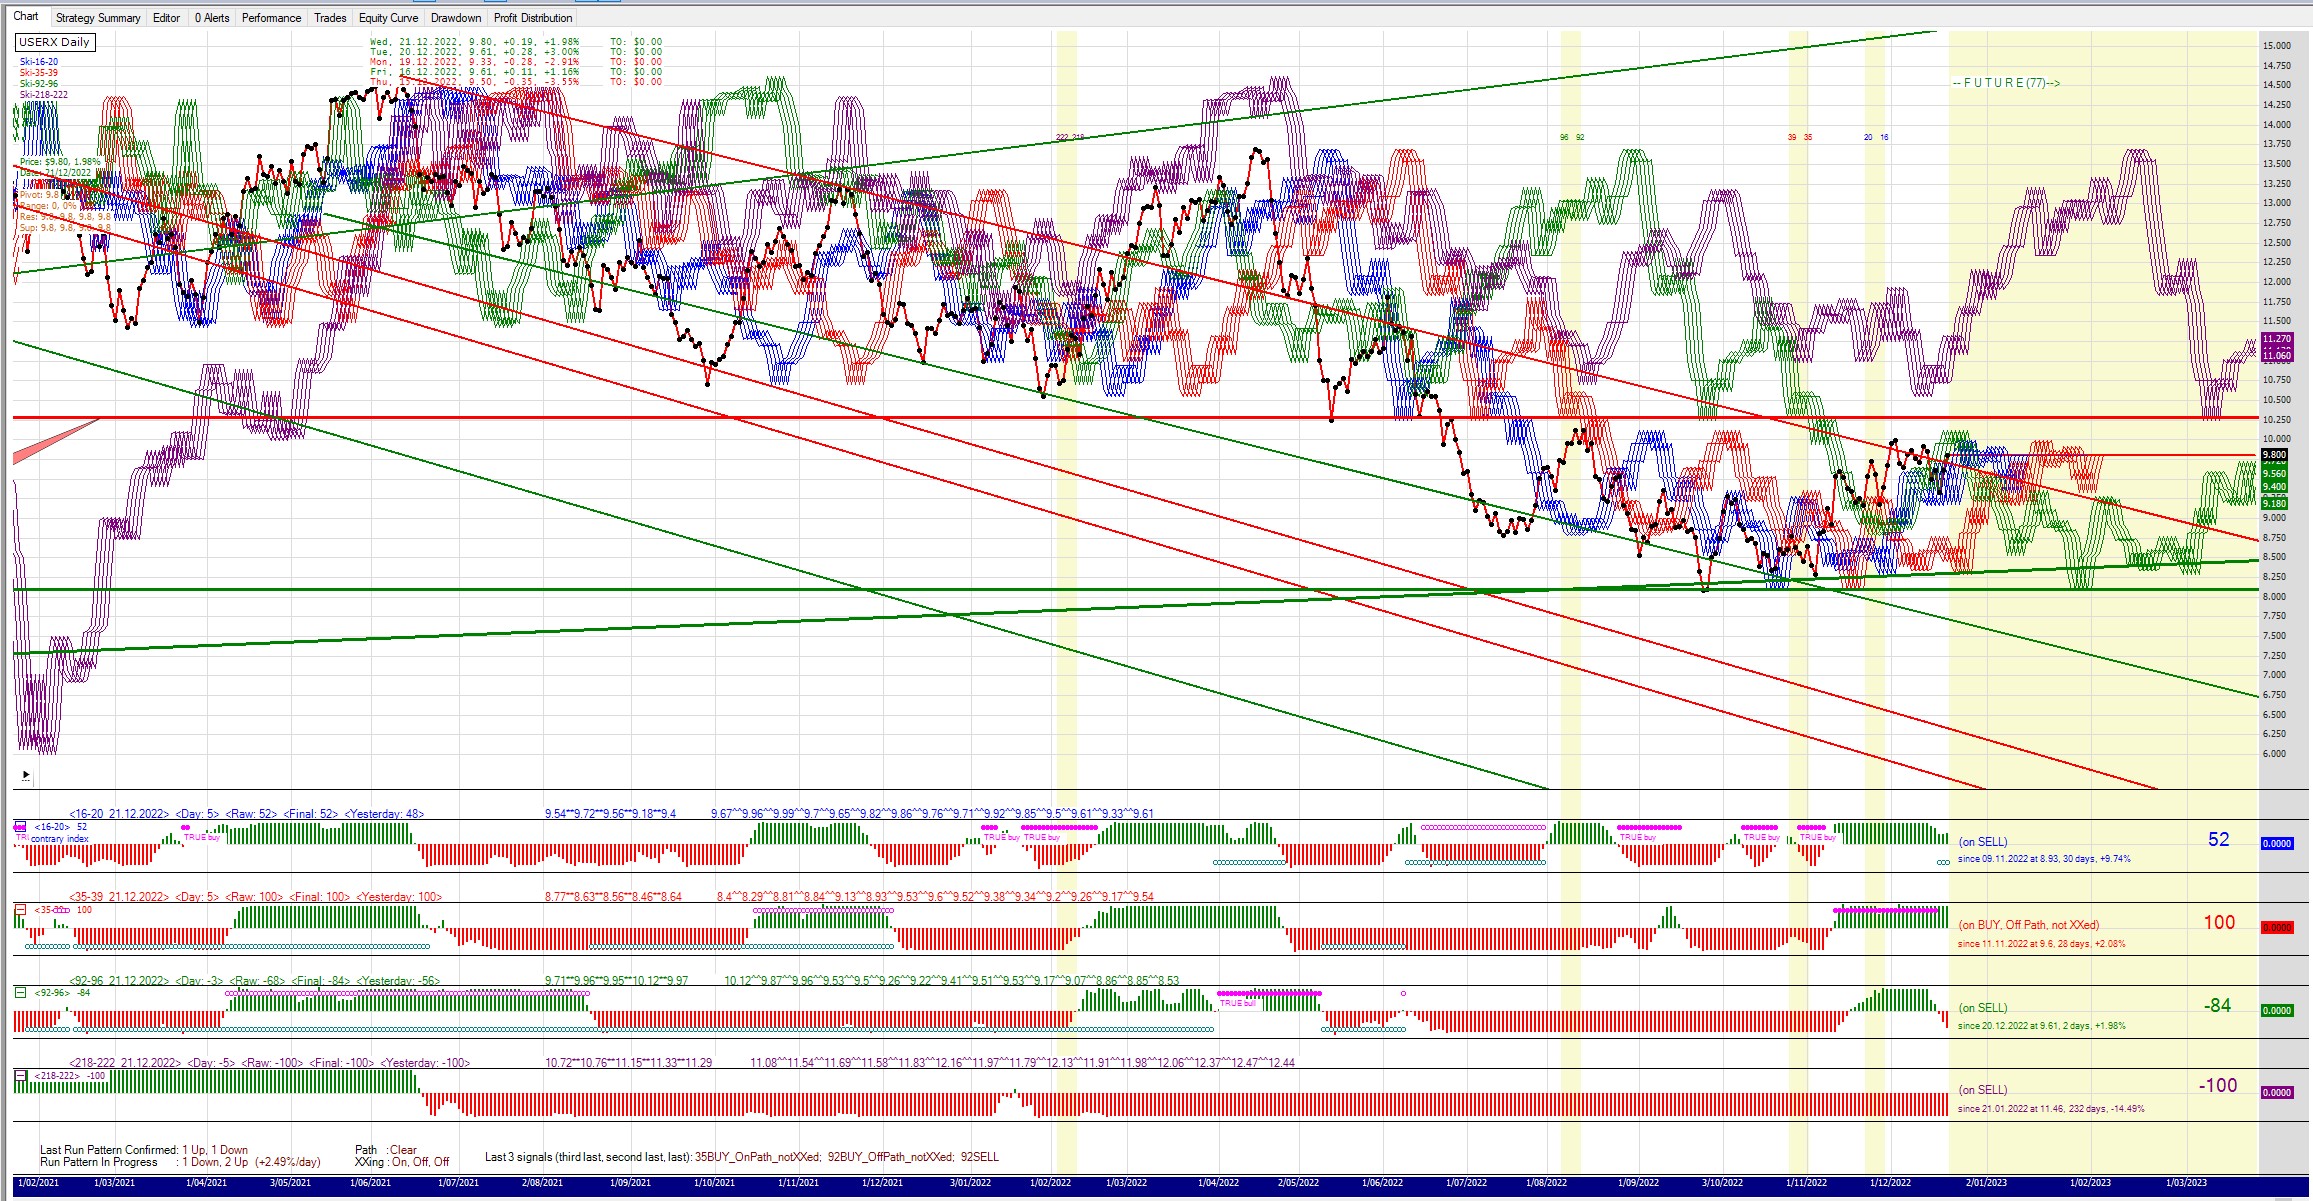
Thursday 29 December 2022

USERX and XGD.AX charts

 USERX


USERX long indices


XGD.AX


Wednesday 28 December 2022

The State Of Indices

 SandP 500, 35-39 crossed to BUY, onpath, xxed (also, 16-20 on BUY; 35-39 to SELL 3770/-0.34% or lower; 92-96 on SELL; 218-222 on SELL; current $3783)

*Comment/Dec28: S and P's true bull signal ended. The SKI indices are in a bearish configuration. Today an xxed out 35-39 buy was generated but I think it will have no positive effect on the existing situation (it is xxed). If the month closes under $3852 (36 months MAV) the crash scenario is becoming active again.


HUI, on 35-39 BUY, onpath, notxxed, 35 days, +7.28% (also, 16-20 breaking to BUY; 35-39 on BUY; 92-96 on BUY; 218-222 on SELL; current $229.98)
*comment/Dec28: HUI SKI configuration changed to bullish. The long-term support at $180 survived the test. The opportunity to quickly sell/buy the 92-96 (for a true bull) is gone now. The 16-20 index is being touched but it behaves like support. If the price drops towards a 16-20 buy signal and cannot hold the 35-39 is likely to sell too and that is not wanted ($190 becomes a target again). $230-235 needs to be broken to the upside to target the $270 level.


$NDX - Nasdaq, last signal 35-39 SELL, 6 days, -3.55% (also, 16-20 on BUY; 35-39 breaking to BUY; 92-96 on SELL; 218-222 on SELL; current $10679)
*comment/Dec11: The chart is in a bearish configuration. The 92-96 sold at the resistance. I started a short position ($11608 entry). The initial stop loss at $12110.
NEW/Dec16: Moved the stop loss to breakeven. If the 35-39 index sells I might add to my short position.
NEW/Dec18: Moved the stop loss into profit territory ($11408). Now I will wait to see if the thing can break down. The daily chart looks like there is a lot of space before the technicals become oversold.
NEW/Dec21: Moved the stop loss further into profit ($11200).
NEW/Dec22: My stop loss is hit for a nice profit. Watching now. Ideally, we get a bounce to sell the 16-20 and 35-39 for a double sell signal which I would act upon.
NEW/Dec28: The 35-39 sell signal marked an acceleration point. The chart is very bearish now. I am looking for an entry point. Ideally, a 16-20 sell signal but it has been avoided for now.


$RUT - Russell 2000, last signal 35-39 SELL, 5 days,
-3.09% (also, 16-20 on BUY; 35-39 on SELL; 92-96 on SELL; 218-222 on SELL; current $1722)
*comment/Dec18: The SKI chart structure is bearish. To change to bullish it will now need the price over $1900 but before the 35-39 index generates a sell signal (not expected). If the 35-39 sells down we go (expected).
NEW/Dec21: 35-39 sold. We are now officially in a bear configuration. Rallies should be sold. To reverse the configuration the price needs to rise above $1900.
NEW/Dec28: As expected the 35-39 sell signal marked the acceleration point to the downside. I am looking for an entry point (to short).


$TNX - 10Y yield, on 92-96 BUY onpath, notxxed(true), juxtaposed, 284 days, +149.17% (also, 16-20 crossed to SELL; 35-39 on SELL; 92-96 on BUY; 218-222 on BUY; current 3.89%)
*comment/Dec15: The 10yy is in a bull market. The recent top around 4.2% now looks like a firm resistance and a part of a triple top. The 3.5% mark was hit as I expected and if my triple top theses is correct the target on the downside is 3.0-3.2%ish. In that case, I expect the 92-96 to sell and end the bull market (probably in the last week of Jan 2023). Short-term the 3.35%-3.4% level is firm support that needs to be broken for the move to continue.
NEW/Dec21: As expected, the 3.4% acted as support, and a short-term rally is in progress. The target is 3.9-4.0% area. If 35-39 can buy back (above 4.0%ish) that would be quite bullish and lead to testing the high (not expected).
NEW/Dec28: My upside target is almost achieved (3.9-4.0%). I am observing if this 16-20 sell signal becomes the top and prevents the 35-39 from buying. We are still in a bull market so if the 35-39 index buys back that could cause a further rise to test the top. The markets are becoming increasingly risky.


XAU, on 35-39 BUY, onpath, notxxed, 35 days, +7.96% (also, 16-20 breaking to BUY; 35-39 on BUY; 92-96 on BUY; 218-222 on SELL; current $121.07)
*comment/Dec08: XAU is now in a bullish configuration. The life run low has marked the exact bottom. The 92-96 buy has not marked a short-term top. The stage has been set for a true bull market in mid-Dec but it will now need a steep decline (does not look very probable). We are not in a traditional TA bull market yet (the $123 resistance needs to be cleared for $137 to become a target). This is a very bullish development short-term but it is not great regarding the SKI bull market.
NEW/Dec28: The resistance is still holding. The window of opportunity to quickly sell and buy the 92-96 index (for a true bull) is gone now. The $120-125 area is the level to watch. If it can be taken out it is bullish but how bullish depends on the sequence of the SKI signals. We do not want the 35-39 index to generate a sell signal. If it does we want it to mark a low otherwise $100 will be the target again.


ASA, last signal 92-96 SELL, 11 days, -2.4% (also, 16-20 to BUY 14.18/-0.49% or lower; 35-39 on BUY; 92-96 on SELL; 218-222 on SELL; current $14.25)
*comment/Dec15: 35-39 and 92-96 buy signals have set the stage for a true bull market signal sometime in late December or early January. Two steps are needed, a 92-96 sell signal first and then a 92-96 buy signal before the 35-39 index sells. The first step is done, the 92-96 sold. This is a very bullish development considering that the ASA index has been the leading indicator for the sector for a while.
NEW/Dec28: $14.8-15.0 is behaving like a firm resistance. We need an immediate rise to generate a true bull signal or the setup will be lost. The feeling is that there is just not enough momentum to generate this signal and that a correction is needed before any bullish move is going to happen.


Bitcoin, on 16-20 BUY, onpath, notxxed, 9 days, -1.83% (also, 16-20 breaking to SELL; 35-39 breaking to SELL; 92-96 on SELL; 218-222 on SELL; current $16550
*comment/Dec11: BTC is in a bear market configuration. Targets on the downside are $13796 then $12150 then $9475 then $7500. To negate the bearish configuration a rise over $20-21K is needed.
NEW/Dec21: 16-20 bought and the 35-39 could buy soon for a double buy. I might go long in that case, target 21K.
NEW/Dec28: The 35-39 bought but I didn't. I'll stay away till my targets are hit or the SKI structure changes.


COPX (copper miners ETF), on 35-39 BUY, onpath, notxxed(true), 35 days, +9.71% (also, 16-20 to NOT BUY 36.2/+0.42% or higher; 35-39 on BUY; 92-96 on BUY; 218-222 on SELL; current $36.05)
*comment/Dec11: COPX is in a bullish constellation. I am still not sure of the long-term implications of the recent SKI signals. If a recession is looming and the SandP is bearish I do not know how the COPX can be bullish. Let's see what happens.


DXY (dollar index), last signal 92-96 SELL, 18 days,
-0.04% (also, 16-20 on BUY; 35-39 on SELL; 92-96 on SELL; 218-222 on BUY; current $104.46)
*comment/Dec15: The longest (by far) DXY bull in 50 years is over. The SKI structure is turning bearish. My target at 103 was hit today and should represent support. This support emanates from the bottom of May 2021 and is the last defence before the bear market takes over. I expect a bounce to sell the 16-20 (rise to $106ish) which should be used to start shorting.


GDX, on 35-39 BUY, onpath, notxxed(true), 35 days, +7.58% (also, 16-20 to NOT BUY 29.06/+1.32% or higher; 35-39 on BUY; 92-96 on BUY; 218-222 on SELL; current $28.68)
*comment/Dec28: The chart is in a bullish configuration. The transition to a true bull market is not possible anymore so we will be relying on 16-20 and 35-39 signals for further assessment. $30 is resistance, and $26 is support.


GDXJ, on 35-39 BUY, onpath, notxxed(true), 35 days, +8.58% (also, 16-20 to BUY 35.16/-1.46% or lower; 35-39 on BUY; 92-96 on BUY; 218-222 on SELL; current $35.68)
*comment/Dec28: The chart is in a bullish configuration. The transition to a true bull market is not possible anymore so we will be relying on 16-20 and 35-39 signals for further assessment. $37.5ish is resistance, $30ish is support.


GLD, on 35-39 BUY, onpath, notxxed(true), 33 days, +2.71% (also, 16-20 breaking to BUY; 35-39 on BUY; 92-96 breaking to SELL; 218-222 on SELL; current $167.91)
*comment/Dec28: The GLD chart structure is turning bullish but it needs more work. The 35-39 and the 92-96 indexes bought which implies that the bottom is in. We didn't get the weakness when needed for a transition to a true bull market. It is still possible but now it would require 'threading a needle' which usually doesn't happen. 16-20 and 35-39 signals are now in charge of what happens so let's wait and see how the situation develops. $168-170 is resistance, and $162 is support.


SLV, on 35-39 BUY, onpath, notxxed(true), 45 days, +20.94% (also, 16-20 on SELL; 35-39 on BUY; 92-96 on BUY; 218-222 breaking to SELL, current $21.6)
*comment/Dec28: The SKI structure is bullish. The target is $23.5ish. The short-term resistance is 22.3ish, support is $20.0-20.5. It seems like SLV will need a correction before it will be able to break the resistance.


TIP, on 35-39 BUY, onpath, notxxed(true), 26 days, -0.22% (also, 16-20 breaking to SELL; 35-39 breaking to SELL; 92-96 on SELL; 218-222 on SELL, current $106.32)
*comment/Dec11: TIPs are in a bearish configuration but the tide is turning. I think that $114 is the target on the upside, $105 should act as support.
NEW/Dec28: 16-20 buy signal has been generated. If I was trading TIPs I'd probably go long this signal (35-39 sell as a stop loss).


TLT, on 35-39 BUY, onpath, notxxed(true), 19 days, -5.87% (also, 16-20 crossed to BUY; 35-39 on BUY; 92-96 on SELL; 218-222 on SELL; current $99.55)
*comment/Dec11: TLT is in a bearish configuration but the tide is turning. The bottom might be in but we will not be sure before the 92-96 buys (which could take weeks). $101 should act as support.
NEW/Dec28: 16-20 buy signal has been generated. If I was trading TLT I'd probably go long this signal (35-39 sell as a stop loss).


UCO (crude oil ETF), last signal 35-39 SELL, 21 days,
-0.14% (also, 16-20 to SELL 30.81/+5.88% or higher; 35-39 on SELL; 92-96 on SELL; 218-222 to BUY 31.44/+8.04% or higher; current 29.1)
*comment/Dec01: The UCO is in a bearish configuration. I have no short-term expectations, it can go either way. $25 is firm support, and $35 is strong resistance.
NEW/Dec11: We are at significant support and the 218-222 index sold. I take that as a bearish sign. This signal is actionable (short side) but I would wait until two closes under $25 or a new 16-20 sell signal before a 218-222 buy signal.
NEW/Dec15: I was right not to go short last week. The 218-222 sell signal caused a short-term rally. If the 218-222 buys back everything will go back to neutral. Having said that, my statement from the last week stays firm, the 16-20 sell signal before the 218-222 buy signal is a selling point. Another selling point is two consecutive closes under $25.0.
NEW/Dec28: The signals are approaching. Let's see the order first and then decide what to do.


URA (uranium stocks ETF), last signal 35-39 SELL, 8 days, +0.62% (also, 16-20 breaking to SELL; 35-39 breaking to BUY; 92-96 on SELL; 218-222 on SELL; current $19.61)
*comment/Dec16: I was right not trusting the 92-96 true buy. It has sold and the 35-39 sold too for a double sell signal. That seems dangerous. The potential for a crash is significant (to $13ish) but before that $18 is an important support.


USERX, last signal 92-96 SELL, 6 days, +1.04%; run pattern in-progress 2U/1D/-1.02%perday; xxing=on_off_off (also, 16-20 to BUY 9.66/-0.51% or lower; 35-39 on BUY; 92-96 breaking to BUY (cannot buy tomorrow); 218-222 on SELL; current $9.71)
*comment/Dec21: USERX is in a bearish configuration but that can change quickly if the 92-96 index buys back. If that happens before the 16-20 buy signal we will get a bullish development identical to the 1993 true bull signal. Accompanied by the 200 MAV breakout and smashing through the trendline it all will look super bullish.
If the 16-20 buys before the 92-96 (without the 35-39 selling) we will get a double buy. Very bullish too but not a true bull market.
If the price drops and sells the 35-39 index it will not be automatically bearish because a turnaround and buying back both 35-39 and 92-96 will constitute a bullish double buy that can be bought for a strong rally but not a bull market.
To turn everything bearish the recent low needs to be exceeded ($8) but that is not expected except if the general market goes into a serious crash (not expected).


Australian XGD, on 35-39 BUY, onpath, notxxed(true), 42 days, +21.29% (also, 16-20 breaking to BUY; 35-39 on BUY; 92-96 on BUY; 218-222 to BUY 6425/+7.37% or higher; current $5984)
*comment/Dec21: The XGD chart configuration is now bullish. The 35-39 and 92-96 bought and holding. I am 35% long and looking to buy more on weak days (added some PRU and RED this week). The 218-222 generated a sell signal as expected. This might be bearish at least short-term because in the recent two years this index was acting as resistance. I'd like to see the XGD price around $5400 before I start serious buying. If that doesn't happen I will buy a break above $6000 and follow the momentum but my stops will be tight.
NEW/Dec28: $6000 acts as a firm resistance. It seems I will get that weakness that I was hoping for but the structure will not be as desired. I am not doing anything before either $6000 is broken or the price corrects down to at least $5400.

USERX and XGD.AX charts

 USERX


USERX long indices


XGD.AX


Tuesday 20 December 2022

The State Of Indices 21/12/2022

 SandP 500, 16-20 BUY executed today, onpath, notxxed (also, 16-20 breaking to SELL; 35-39 to NOT SELL 3830/+0.24% or higher; 92-96 on SELL; 218-222 on SELL; current $3821)

*Comment/Dec11: S and P's true bull signal ended. That was expected. I am now short this market again (sold Nasdaq instead of SandP because I see the better potential). The initial stop loss is $4120. The acceleration level to watch on the short side is $3860 (36 months MAV).
NEW/Dec21: Today's close is under the $3852 important level. This might start the acceleration to the downside. If not, there is a confluence of future prices at the $4000 level in mid-January. This confluence might be a target for a Santa rally but I doubt it. My bias is to the downside.


HUI, on 35-39 BUY, onpath, notxxed, 30 days, +6.93% (also, 16-20 to BUY 216.35/-5.62% or lower; 35-39 on BUY; 92-96 on BUY; 218-222 on SELL; current $229.23)
*comment/Nov25: HUI SKI configuration changed to bullish. The long-term support at $180 survived the test. The resistance at $230 needs to be broken for $270 to become a target. A dip down to under $210 is needed into mid-December to transform the structure into a true bull market.
NEW/Dec21: The resistance is still holding. The breaking of the 16-20 index is happening. A potential buy signal might mark the bottom. If the buy is generated and it doesn't mark the bottom the 35-39 is probable to sell (not wanted). The opportunity to quickly sell/buy the 92-96 (for a true bull) seems gone now. The $230-235 area is the level to watch, if it can be taken out it is bullish ($270 target). If it cannot be taken out the 35-39 will sell and $190 will become the target again.


$NDX - Nasdaq, 35-39 SELL executed today (also, 16-20 breaking to SELL; 35-39 breaking to BUY; 92-96 on SELL; 218-222 on SELL; current $11072)
*comment/Dec11: The chart is in a bearish configuration. The 92-96 sold at the resistance. I started a short position ($11608 entry). The initial stop loss at $12110.
NEW/Dec16: Moved the stop loss to breakeven. If the 35-39 index sells I might add to my short position.
NEW/Dec18: Moved the stop loss into profit territory ($11408). Now I will wait to see if the thing can break down. The daily chart looks like there is a lot of space before the technicals become oversold.
NEW/Dec21: Moved the stop loss further into profit ($11200).


$RUT - Russell 2000, 35-39 crossed to SELL (also, 16-20 on BUY; 35-39 breaking to BUY; 92-96 on SELL; 218-222 on SELL; current $1748)
*comment/Dec18: The SKI chart structure is bearish. To change to bullish it will now need the price over $1900 but before the 35-39 index generates a sell signal (not expected). If the 35-39 sells down we go (expected).
NEW/Dec21: 35-39 sold. We are now officially in a bear configuration. Rallies should be sold. To reverse the configuration the price needs to rise above $1900.


$TNX - 10Y yield, on 92-96 BUY onpath, notxxed(true), juxtaposed, 279 days, +136.15% (also, 16-20 on BUY; 35-39 on SELL; 92-96 on BUY; 218-222 on BUY; current 3.68%)
*comment/Dec15: The 10yy is in a bull market. The recent top around 4.2% now looks like a firm resistance and a part of a triple top. The 3.5% mark was hit as I expected and if my triple top theses is correct the target on the downside is 3.0-3.2%ish. In that case, I expect the 92-96 to sell and end the bull market (probably in the last week of Jan 2023). Short-term the 3.35%-3.4% level is firm support that needs to be broken for the move to continue.
NEW/Dec21: As expected, the 3.4% acted as support, and a short-term rally is in progress. The target is 3.9-4.0% area. If 35-39 can buy back (above 4.0%ish) that would be quite bullish and lead to testing the high (not expected).


XAU, on 35-39 BUY, onpath, notxxed, 30 days, +7.56% (also, 16-20 to BUY 113.36/-6.02% or lower; 35-39 on BUY; 92-96 on BUY; 218-222 on SELL; current $120.62)
*comment/Dec08: XAU is now in a bullish configuration. The life run low has marked the exact bottom. The 92-96 buy has not marked a short-term top. The stage has been set for a true bull market in mid-Dec but it will now need a steep decline (does not look very probable). We are not in a traditional TA bull market yet (the $123 resistance needs to be cleared for $137 to become a target). This is a very bullish development short-term but it is not great regarding the SKI bull market.
NEW/Dec21: The resistance is still holding. The breaking of the 16-20 index is happening. A potential buy signal might mark the bottom. If not there is still a window of opportunity to quickly sell and buy the 92-96 index (for a true bull) but that now looks like threading a needle and these scenarios are usually less probable and meaningless. Right now the most probable bullish scenario is for the 16-20 buy signal to mark the low and propel the price above the 125ish resistance level for a new leg up. In any case, the $120-125 area is the level to watch. If it can be taken out it is bullish but how bullish depends on the sequence of the SKI signals. If it cannot be taken out then $100 will become the target again.


ASA, last signal 92-96 SELL, 6 days, -0.41% (also, 16-20 on SELL; 35-39 on BUY; 92-96 on SELL; 218-222 on SELL; current $14.54)
*comment/Dec15: 35-39 and 92-96 buy signals have set the stage for a true bull market signal sometime in late December or early January. Two steps are needed, a 92-96 sell signal first and then a 92-96 buy signal before the 35-39 index sells. The first step is done, the 92-96 sold. This is a very bullish development considering that the ASA index has been the leading indicator for the sector for a while.


Bitcoin, 16-20 BUY executed today, onpath, notxxed (also, 16-20 breaking to SELL; 35-39 to BUY 16885/+0.16% or higher; 92-96 on SELL; 218-222 on SELL; current $16858
*comment/Dec11: BTC is in a bear market configuration. Targets on the downside are $13796 then $12150 then $9475 then $7500. To negate the bearish configuration a rise over $20-21K is needed.
NEW/Dec21: 16-20 bought and tomorrow the 35-39 could buy for a double buy. I might go long, target 21K.


COPX (copper miners ETF), on 35-39 BUY, onpath, notxxed(true), 30 days, +8.89% (also, 16-20 on SELL; 35-39 on BUY; 92-96 on BUY; 218-222 breaking to BUY; current $35.78)
*comment/Dec11: COPX is in a bullish constellation. I am still not sure of the long-term implications of the recent SKI signals. If a recession is looming and the SandP is bearish I do not know how the COPX can be bullish. Let's see what happens.


DXY (dollar index), last signal 92-96 SELL, 13 days, -0.44% (also, 16-20 on BUY; 35-39 on SELL; 92-96 on SELL; 218-222 on BUY; current $104.05)
*comment/Dec15: The longest (by far) DXY bull in 50 years is over. The SKI structure is turning bearish. My target at 103 was hit today and should represent support. This support emanates from the bottom of May 2021 and is the last defence before the bear market takes over. I expect a bounce to sell the 16-20 (rise to $106ish) which should be used to start shorting.


GDX, on 35-39 BUY, onpath, notxxed(true), 30 days, +7.8% (also, 16-20 breaking to BUY; 35-39 on BUY; 92-96 on BUY; 218-222 on SELL; current $28.74)
*comment/Nov17: The chart is now bullish but needs more work to strengthen the structure. The stage has been set for a true bull market. It requires weakness into mid-December to generate bullish signals. To prevent a bearish outcome the 35-39 shouldn't sell as long as it is under the 92-96 index (end of December).
NEW/Nov25: If we do not get the weakness into December it is quite possible that we see a strong rally into Jan-Feb to challenge the 2021/2022 highs before we come crashing down to set up a real bull market in the second part of 2023.
NEW/Dec16: Finally some weakness. Let's see if we can sell the 92-96 and avoid selling the 35-39 before the 92-96 buys back. This is needed for the proper SKI bull market signal.
NEW/Dec21: The 16-20 is behaving as support for now. The window of opportunity is closing for transitioning into a true bull market. Only a few days left.


GDXJ, on 35-39 BUY, onpath, notxxed(true), 30 days, +8.49% (also, 16-20 to BUY 33.42/-6.26% or lower; 35-39 on BUY; 92-96 breaking to SELL; 218-222 on SELL; current $35.65)
*comment/Nov17: The chart is now bullish but needs more work to strengthen the structure. The stage has been set for a true bull market. It requires weakness into mid-December to generate bullish signals. To prevent a bearish outcome the 35-39 shouldn't sell as long as it is under the 92-96 index (end of December).
NEW/Nov25: If we do not get the weakness into December it is quite possible that we see a strong rally into Jan-Feb to challenge the 2021/2022 highs before we come crashing down to set up a real bull market in the second part of 2023.
NEW/Dec16: Finally some weakness. Let's see if we can sell the 92-96 and avoid selling the 35-39 before the 92-96 buys back. This is needed for the proper SKI bull market signal.
NEW/Dec21: The 16-20 is behaving as support for now. The window of opportunity is closing for transitioning into a true bull market. The EOY is a deadline.


GLD, on 35-39 BUY, onpath, notxxed(true), 28 days, +3.43% (also, 16-20 on SELL; 35-39 on BUY; 92-96 breaking to SELL; 218-222 breaking to BUY; current $169.08)
*comment/Nov20: The GLD chart structure is turning bullish but it needs more work. The 35-39 and the 92-96 indexes bought which implies that the bottom is in. The 92-96 buy should mark a short-term top (with a $158-160 target on the downside). An acceleration point would be a break above $168. For now, the 35-39 index is the line between the bull and the bear (the 35-39 buy signal needs to hold until at least the end of December).
NEW/Nov25: If we do not get the weakness into December it is quite possible that we see a strong rally into Jan-Feb to challenge the 2021/2022 highs before we come crashing down to set up a real bull market in the second part of 2023.
NEW/Dec11: GLD price is close to that important $168 level mentioned above. It is time for a correction/consolidation if the market is going to morph into a true bull market. Ideally, the correction wouldn't go under $162 for more than a couple of days. It is a decision time.
NEW/Dec16: The 92-96 started breaking toward a sell signal (needed to clear the path) before a true bull signal takes over. We do not want the price to go under $162 for more than a couple of days otherwise the 35-39 will sell and end the bullish setup.


SLV, on 35-39 BUY, onpath, notxxed(true), 40 days, +24.47% (also, 16-20 on SELL; 35-39 on BUY; 92-96 on BUY; 218-222 breaking to SELL, current $22.23)
*comment/Dec21: The SKI structure is bullish. Today's action looks like the continuation of the uptrend. The target is $23.5ish. The short-term support is $21.5.


TIP, on 35-39 BUY, onpath, notxxed(true), 21 days, +0.59% (also, 16-20 breaking to BUY; 35-39 on BUY; 92-96 on SELL; 218-222 on SELL, current $107.18)
*comment/Dec11: TIPs are in a bearish configuration but the tide is turning. I think that $114 is the target on the upside, $105 should act as support.
NEW/Dec21: 16-20 buy signal is approaching. If I was trading TIPs I'd probably buy.


TLT, on 35-39 BUY, onpath, notxxed(true), 14 days, -2.19% (also, 16-20 on SELL; 35-39 on BUY; 92-96 on SELL; 218-222 on SELL; current $103.44)
*comment/Dec11: TLT is in a bearish configuration but the tide is turning. The bottom might be in but we will not be sure before the 92-96 buys (which could take weeks). $101 should act as support.
NEW/Dec21: 16-20 buy signal is approaching. If I was trading TLT I'd probably buy.


UCO (crude oil ETF), last signal 35-39 SELL, 16 days,
-6.62% (also, 16-20 on BUY; 35-39 on SELL; 92-96 on SELL; 218-222 breaking to BUY, current 27.21)
*comment/Dec01: The UCO is in a bearish configuration. I have no short-term expectations, it can go either way. $25 is firm support, and $35 is strong resistance.
NEW/Dec11: We are at significant support and the 218-222 index sold. I take that as a bearish sign. This signal is actionable (short side) but I would wait until two closes under $25 or a new 16-20 sell signal before a 218-222 buy signal.
NEW/Dec15: I was right not to go short last week. The 218-222 sell signal caused a short-term rally. If the 218-222 buys back everything will go back to neutral. Having said that, my statement from the last week stays firm, the 16-20 sell signal before the 218-222 buy signal is a selling point. Another selling point is two consecutive closes under $25.0.


URA (uranium stocks ETF), last signal 35-39 SELL, 3 days, -1.08% (also, 16-20 on BUY; 35-39 breaking to BUY; 92-96 on SELL; 218-222 breaking to BUY; current $19.28)
*comment/Dec16: I was right not trusting the 92-96 true buy. It has sold and the 35-39 sold too for a double sell signal. That seems dangerous. The potential for a crash is significant (to $13ish) but before that $18 is an important support.


USERX, 92-96 SELL executed today; run pattern in-progress 1D/1U/+3.0%perday; xxing=on_off_off (also, 16-20 to BUY 9.18/-4.47% or lower; 35-39 on BUY; 92-96 breaking to BUY (cannot buy tomorrow); 218-222 on SELL; current $9.61)
*comment/Dec21: USERX is in a bearish configuration but that can change quickly if the 92-96 index buys back. If that happens before the 16-20 buy signal we will get a bullish development identical to the 1993 true bull signal. Accompanied by the 200 MAV breakout and smashing through the trendline it all will look super bullish.
If the 16-20 buys before the 92-96 (without the 35-39 selling) we will get a double buy. Very bullish too but not a true bull market.
If the price drops and sells the 35-39 index it will not be automatically bearish because a turnaround and buying back both 35-39 and 92-96 will constitute a bullish double buy that can be bought for a strong rally but not a bull market.
To turn everything bearish the recent low needs to be exceeded but that is not expected except if the general market goes into a serious crash (not expected).


Australian XGD, on 35-39 BUY, onpath, notxxed(true), 38 days, +16.94% (also, 16-20 breaking to BUY; 35-39 on BUY; 92-96 on BUY; 218-222 breaking to BUY; current $5769)
*comment/Dec21: The XGD chart configuration is now bullish. The 35-39 and 92-96 bought and holding. I am 35% long and looking to buy more on weak days (added some PRU and RED this week). The 218-222 generated a sell signal as expected. This might be bearish at least short-term because in the recent two years this index was acting as resistance. I'd like to see the XGD price around $5400 before I start serious buying. If that doesn't happen I will buy a break above $6000 and follow the momentum but my stops will

USERX and XGD.AX charts

 USERX


USERX long indices


XGD.AX


Monday 19 December 2022

1993 vs 2005 vs now

 1993


2005


2022

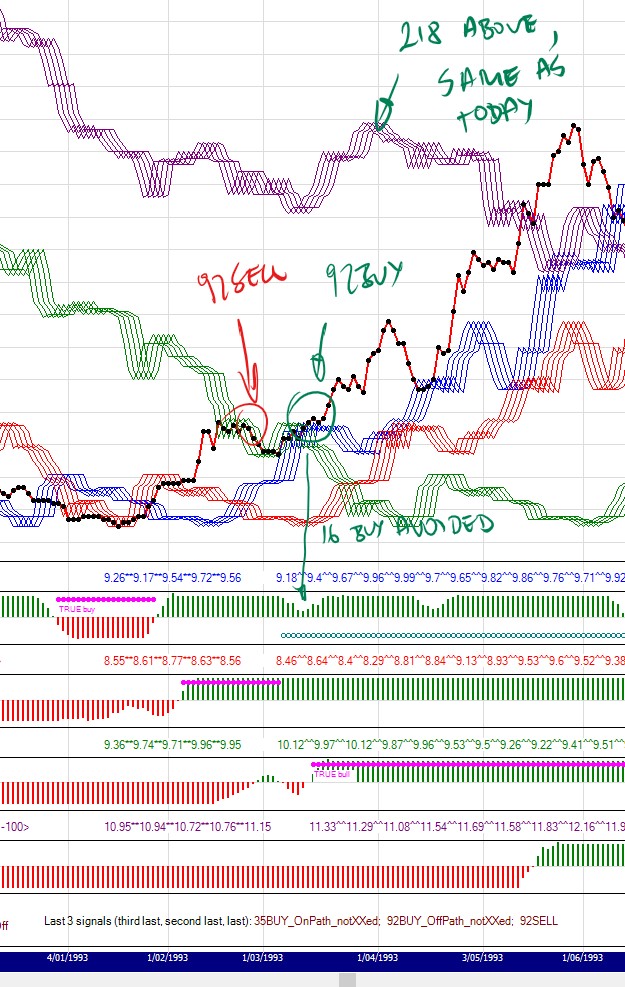
see how 16, 35, 92 and 216 are in the same relative positions as in 1993. The 2005 setup was different, 216 already was on a buy signal. 

If the correction stops today we get the same signals as in 1993. If the 16 buys and then the 92 buys we get a double buy, which is better than the 1993 sequence. If the 35 sells the whole setup is ruined and we are back to sideways or down.  

The question is also what if 35 sells and then 92 buys followed by a 35 buy. I think we buy the second close above the red trendline for a strong rally (but not the bull market). 


USERX and XGD.AX charts

 USERX


USERX long indices


XGD.AX


Saturday 17 December 2022

The State Of Indices

 SandP 500, 16-20 crossed to SELL (also, 16-20 to NOT BUY 4003/+3.93% or higher; 35-39 breaking to SELL; 92-96 on SELL; 218-222 on SELL; current $3852)

*Comment/Dec11: S and P's true bull signal ended. That was expected. I am now short this market again (sold Nasdaq instead of SandP because I see the better potential). The initial stop loss is $4120. The acceleration level to watch on the short side is $3860 (36 months MAV).
NEW/Dec16: Moved the stop loss to breakeven.
NEW/Dec18: Today's close is under the $3852 important level. This might start the acceleration to the downside. If not, there is a confluence of future prices at the $4000 level in mid-January. This confluence might be a target for a Santa rally but I doubt it. My bias is to the downside.


HUI, on 35-39 BUY, onpath, notxxed, 28 days, +3.54% (also, 16-20 breaking to BUY; 35-39 on BUY; 92-96 on BUY; 218-222 on SELL; current $221.96)
*comment/Nov25: HUI SKI configuration changed to bullish. The long-term support at $180 survived the test. The resistance at $230 needs to be broken for $270 to become a target. A dip down to under $210 is needed into mid-December to transform the structure into a true bull market.
NEW/Dec18: The resistance is still holding. The breaking of the 16-20 index is happening. A potential buy signal might mark the bottom. If not there is still a window of opportunity to quickly sell and buy the 92-96 index (for a true bull) but that now looks like threading a needle and these scenarios are usually less probable and meaningless. Right now the most probable bullish scenario is for the 16-20 buy signal to mark the low and propel the price above the 235ish resistance level for a new leg up. In any case, the $230-235 area is the level to watch. If it can be taken out it is bullish but how bullish depends on the sequence of the SKI signals. If it cannot be taken out then $190 will become the target again.


$NDX - Nasdaq, 16-20 BUY executed today (juxtaposed, bearish) (also, 16-20 breaking to SELL; 35-39 to NOT SELL 11406/+1.45% or higher; 92-96 on SELL; 218-222 on SELL; current $11243)
*comment/Dec11: The chart is in a bearish configuration. The 92-96 sold at the resistance. I started a short position ($11608 entry). The initial stop loss at $12110.
NEW/Dec16: Moved the stop loss to breakeven. If the 35-39 index sells I might add to my short position.
NEW/Dec18: Moved the stop loss into profit territory ($11408). Now I will wait to see if the thing can break down. The daily chart looks like there is a lot of space before the technicals become oversold.


$RUT - Russell 2000, last signal 92-96 SELL, 5 days,
-3.03% (also, 16-20 on BUY; 35-39 breaking to SELL; 92-96 on SELL; 218-222 on SELL; current $1763)
*comment/Dec18: The SKI chart structure is bearish. To change to bullish it will now need the price over $1900 but before the 35-39 index generates a sell signal (not expected). If the 35-39 sells down we go (expected).


$TNX - 10Y yield, on 92-96 BUY onpath, notxxed(true), juxtaposed, 277 days, +123.21% (also, 16-20 on BUY; 35-39 on SELL; 92-96 on BUY; 218-222 on BUY; current 3.48%)
*comment/Dec15: The 10yy is in a bull market. The recent top around 4.2% now looks like a firm resistance and a part of a triple top. The 3.5% mark was hit as I expected and if my triple top theses is correct the target on the downside is 3.0-3.2%ish. In that case, I expect the 92-96 to sell and end the bull market (probably in the last week of Jan 2023). Short-term the 3.35%-3.4% level is firm support that needs to be broken for the move to continue.


XAU, on 35-39 BUY, onpath, notxxed, 28 days, +4.85% (also, 16-20 breaking to BUY; 35-39 on BUY; 92-96 on BUY; 218-222 breaking to BUY; current $117.58)
*comment/Dec08: XAU is now in a bullish configuration. The life run low has marked the exact bottom. The 92-96 buy has not marked a short-term top. The stage has been set for a true bull market in mid-Dec but it will now need a steep decline (does not look very probable). We are not in a traditional TA bull market yet (the $123 resistance needs to be cleared for $137 to become a target). This is a very bullish development short-term but it is not great regarding the SKI bull market.
NEW/Dec18: The resistance is still holding. The breaking of the 16-20 index is happening. A potential buy signal might mark the bottom. If not there is still a window of opportunity to quickly sell and buy the 92-96 index (for a true bull) but that now looks like threading a needle and these scenarios are usually less probable and meaningless. Right now the most probable bullish scenario is for the 16-20 buy signal to mark the low and propel the price above the 125ish resistance level for a new leg up. In any case, the $120-125 area is the level to watch. If it can be taken out it is bullish but how bullish depends on the sequence of the SKI signals. If it cannot be taken out then $100 will become the target again.


ASA, last signal 92-96 SELL, 4 days, -2.4% (also, 16-20 on SELL; 35-39 on BUY; 92-96 on SELL; 218-222 on SELL; current $14.25)
*comment/Dec15: 35-39 and 92-96 buy signals have set the stage for a true bull market signal sometime in late December or early January. Two steps are needed, a 92-96 sell signal first and then a 92-96 buy signal before the 35-39 index sells. The first step is done, the 92-96 sold. This is a very bullish development considering that the ASA index has been the leading indicator for the sector for a while.


Bitcoin, last signal 16-20 SELL, 16 days, -2.13% (also, 16-20 breaking to BUY; 35-39 breaking to BUY; 92-96 on SELL; 218-222 on SELL; current $16725
*comment/Dec11: BTC is in a bear market configuration. Targets on the downside are $13796 then $12150 then $9475 then $7500. To negate the bearish configuration a rise over $20-21K is needed.


COPX (copper miners ETF), on 35-39 BUY, onpath, notxxed(true), 28 days, +8.7% (also, 16-20 on SELL; 35-39 on BUY; 92-96 on BUY; 218-222 breaking to BUY; current $35.72)
*comment/Dec11: COPX is in a bullish constellation. I am still not sure of the long-term implications of the recent SKI signals. If a recession is looming and the SandP is bearish I do not know how the COPX can be bullish. Let's see what happens.


DXY (dollar index), last signal 92-96 SELL, 11 days, +0.32% (also, 16-20 on BUY; 35-39 on SELL; 92-96 breaking to BUY; 218-222 on BUY; current $104.84)
*comment/Dec15: The longest (by far) DXY bull in 50 years is over. The SKI structure is turning bearish. My target at 103 was hit today and should present support. This support emanates from the bottom of May 2021 and is the last defence before the bear market takes over. I expect a bounce to sell the 16-20 (rise to $106ish) which should be used to start shorting.


GDX, on 35-39 BUY, onpath, notxxed(true), 28 days, +7.28% (also, 16-20 breaking to BUY; 35-39 on BUY; 92-96 on BUY; 218-222 breaking to BUY; current $28.6)
*comment/Nov17: The chart is now bullish but needs more work to strengthen the structure. The stage has been set for a true bull market. It requires weakness into mid-December to generate bullish signals. To prevent a bearish outcome the 35-39 shouldn't sell as long as it is under the 92-96 index (end of December).
NEW/Nov25: If we do not get the weakness into December it is quite possible that we see a strong rally into Jan-Feb to challenge the 2021/2022 highs before we come crashing down to set up a real bull market in the second part of 2023.
NEW/Dec16: Finally some weakness. Let's see if we can sell the 92-96 and avoid selling the 35-39 before the 92-96 buys back. This is needed for the proper SKI bull market signal.


GDXJ, on 35-39 BUY, onpath, notxxed(true), 28 days, +7.21% (also, 16-20 breaking to BUY; 35-39 on BUY; 92-96 on BUY; 218-222 on SELL; current $35.23)
*comment/Nov17: The chart is now bullish but needs more work to strengthen the structure. The stage has been set for a true bull market. It requires weakness into mid-December to generate bullish signals. To prevent a bearish outcome the 35-39 shouldn't sell as long as it is under the 92-96 index (end of December).
NEW/Nov25: If we do not get the weakness into December it is quite possible that we see a strong rally into Jan-Feb to challenge the 2021/2022 highs before we come crashing down to set up a real bull market in the second part of 2023.
NEW/Dec16: Finally some weakness. Let's see if we can sell the 92-96 and avoid selling the 35-39 before the 92-96 buys back. This is needed for the proper SKI bull market signal.


GLD, on 35-39 BUY, onpath, notxxed(true), 26 days, +2.02% (also, 16-20 on SELL; 35-39 on BUY; 92-96 breaking to SELL; 218-222 to BUY 168.87/+1.25% or higher; current $166.79)
*comment/Nov20: The GLD chart structure is turning bullish but it needs more work. The 35-39 and the 92-96 indexes bought which implies that the bottom is in. The 92-96 buy should mark a short-term top (with a $158-160 target on the downside). An acceleration point would be a break above $168. For now, the 35-39 index is the line between the bull and the bear (the 35-39 buy signal needs to hold until at least the end of December).
NEW/Nov25: If we do not get the weakness into December it is quite possible that we see a strong rally into Jan-Feb to challenge the 2021/2022 highs before we come crashing down to set up a real bull market in the second part of 2023.
NEW/Dec11: GLD price is close to that important $168 level mentioned above. It is time for a correction/consolidation if the market is going to morph into a true bull market. Ideally, the correction wouldn't go under $162 for more than a couple of days. It is a decision time.
NEW/Dec16: The 92-96 started breaking toward a sell signal (needed to clear the path) before a true bull signal takes over. We do not want the price to go under $162 for more than a couple of days otherwise the 35-39 will sell and end the bullish setup.


SLV, on 35-39 BUY, onpath, notxxed(true), 38 days, +19.65% (also, 16-20 on SELL; 35-39 on BUY; 92-96 on BUY; 218-222 breaking to SELL, current $21.37)
*comment/Dec15: The SKI structure changed to bullish. I expect that the 218-222 index buy (executed today) causes short-term correction. Morphing into a SKI true bull market now seems improbable. A correction to buy the 16-20 index seems a good entry point on the long side.


TIP, on 35-39 BUY, onpath, notxxed(true), 19 days, +0.97% (also, 16-20 on SELL; 35-39 on BUY; 92-96 on SELL; 218-222 on SELL, current $107.58)
*comment/Dec11: TIPs are in a bearish configuration but the tide is turning. I think that $114 is the target on the upside, $105 should act as support.


TLT, on 35-39 BUY, onpath, notxxed(true), 12 days, +1.28% (also, 16-20 on SELL; 35-39 on BUY; 92-96 on SELL; 218-222 on SELL; current $107.11)
*comment/Dec11: TLT is in a bearish configuration but the tide is turning. The bottom might be in but we will not be sure before the 92-96 buys (which could take weeks). $101 should act as support.


UCO (crude oil ETF), last signal 35-39 SELL, 14 days,
-10.09% (also, 16-20 on BUY; 35-39 on SELL; 92-96 on SELL; 218-222 breaking to BUY, current 26.2)
*comment/Dec01: The UCO is in a bearish configuration. I have no short-term expectations, it can go either way. $25 is firm support, and $35 is strong resistance.
NEW/Dec11: We are at significant support and the 218-222 index sold. I take that as a bearish sign. This signal is actionable (short side) but I would wait until two closes under $25 or a new 16-20 sell signal before a 218-222 buy signal.
NEW/Dec15: I was right not to go short last week. The 218-222 sell signal caused a short-term rally. If the 218-222 buys back everything will go back to neutral. Having said that, my statement from the last week stays firm, the 16-20 sell signal before the 218-222 buy signal is a selling point. Another selling point is two consecutive closes under $25.0.


URA (uranium stocks ETF), 35-39 SELL executed today (also, 16-20 on BUY; 35-39 breaking to BUY; 92-96 on SELL; 218-222 breaking to BUY; current $19.49)
*comment/Dec16: I was right not trusting the 92-96 true buy. It has sold and the 35-39 sold too for a double sell signal. That seems dangerous. The potential for a crash is significant (to $13ish) but before that $18 is an important support.


USERX, on 35-39 BUY, onpath, notxxed(true), 25 days,
+0.1%; run pattern in-progress 2D/1U/+1.16%perday; xxing=off_off_off (also, 16-20 breaking to BUY; 35-39 on BUY; 92-96 to NOT SELL 9.71/+1.04% or higher; 218-222 on SELL; current $9.61)
*comment/Nov17: USERX is in a bearish configuration but that is slowly changing. Both 35-39 and 92-96 indexes bought which should be enough to confirm the bottom. To turn this chart really bullish the $10.28 needs to be cleared but I doubt that it will happen quickly. The current 92-96 buy signal should provide resistance and probably lead to a correction. If during the next month the price can stay in the $9.0-10.0 range a true bull market buy signal is probable by the second half of December. If we just keep pushing up and exceed this range ($10.28) without meaningful pause then $11.75 is the target but a true bull market signal will probably be postponed to the second half of 2023. So, the best-case scenario is a consolidation in the $9-10 range until the 92-96 index generates a true buy signal. The condition of the consolidation is that the 35-39 doesn't sell because that would ruin the setup. The current picture aligns well with the dollar and the 10yy signals. There are other encouraging signs too: Platinum (a leading indicator for gold) is already on a true bull signal, Copper broke out, Silver is in the bullish config, etc.
NEW/Nov25: If we do not get the weakness into December it is quite possible that we see a strong rally into Jan-Feb to challenge the 2021/2022 highs before we come crashing down to set up a real bull market in the second part of 2023 (see my dollar comment).
NEW/Dec11: So far, we are keeping nicely inside the bull market required range. Being under $10.12 for another week will penetrate the 92-96 index toward a sell signal. If a larger correction starts it must not sell the 35-39 index yet. A sudden strength would avoid the bull market signal altogether.
NEW/Dec16: It is happening, the 92-96 is breaking towards a sell signal. The timing is perfect. One thing to watch is that the 35-39 index doesn't sell before the 92-96 buys back (if it sells).
One thing on my mind is, what to do if the 35-39 sells but then the 92-96 buys back (as xxed) and takes the path. In this case, I will probably wait until the 35-39 buys back too and go long when the downtrend line is broken (mid-Jan low?).


Australian XGD, on 35-39 BUY, onpath, notxxed(true), 36 days, +17.55% (also, 16-20 on SELL; 35-39 on BUY; 92-96 on BUY; 218-222 crossed to SELL>>to BUY 5973/+3.0% or higher; current $5799)
*comment/Dec18: The XGD chart configuration is now bullish but needs more work. The 35-39 and 92-96 bought and holding. I am 30% long and looking to buy more on weak days (bought some on Friday). The 218-222 generated a sell signal as expected. This might be bearish at least short-term because in the recent two years this index was acting as resistance. I'd like to see the XGD price around $5400 before I start serious buying. If that doesn't happen I will buy a break above $6000 and follow the momentum but my stops will be tight.