
The next signal will be a 92-96 buy or 16-20 sell or 218-222 sell. The one we don't want to happen first if the bottom is in is a 218-222 sell. If the next signal is a 16-20 sell than the following 16-20 buy will be a true buy, therefore, it will provide quite a nice protection to prevent a 218-222 sell. Probably the most desirable scenario would be a slow rise into the 16-20 sell because an explosive rise into the 92-96 buy would open a possibility of a double sell 16-20 and 92-96.
GLD

Similarly to the 2008 crash, the GLD price made a slight secondary high before the real downturn started. The crash lasted 8 days, compared to 10 days in 2008.
Today GLD triggered a true 92-96 buy which will be accompanied with a 35-39 buy for a double buy. This is a mighty bullish pattern. The interesting detail is that it has been triggered on the 222nd day of the ongoing 218-222 buy signal (currently sitting on 24% profit).
HUI, XAU, GDX, GDXJ
All very similar setup as the USERX chart
HUI

XAU

GDX

GDXJ

XGD Australia

14 days ago XGD triggered a triple buy which marked the exact top and the start of the crash. The ensuing 35-39/92-96/218-222 triple sell marked the bottom and today the 218-222 crossed back to the buy territory. It is probably as bad a whipsaw as it gets but still, SKI signals marked important points with amazing precision.
The current setup is very ambiguous but also very potent. I marked some possible scenarios varying from a simple bull rise to a possible double sell that can lead to a possible triple buy. I suppose it is not a setup for faint-hearted traders. Bring it on.
SLV

S and P 500

TLT bonds

UUP dollar

Bitcoin

Inflation
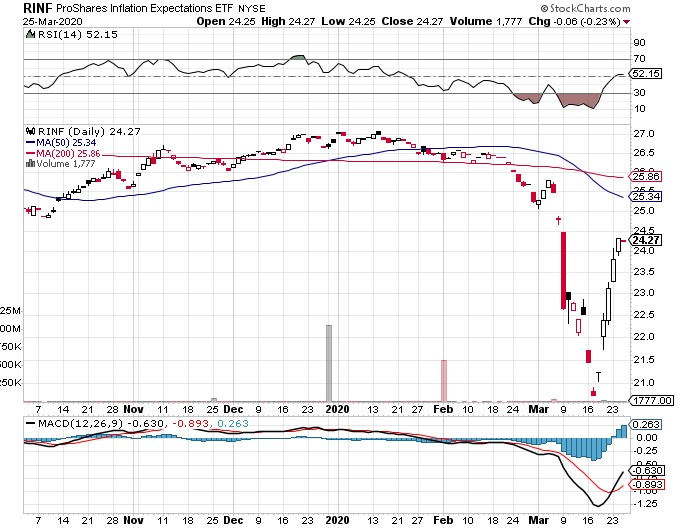
The interesting fact about these charts is that, again, dollar, gold and bonds look like behaving as safe havens all at the same time. I suppose something has to give in the end but the question is when and what? For me, the important fact is that if they keep showing strength all at the same time that means a rocket fuel for the price of gold in AUD which is super bullish for Aussie miners. Let's see what happens.
I am 70% long mostly physical gold and silver. I am trading miners but not keeping long term positions. Some of them started decreasing production due to the difficulties correlated with lockdown policies in place and that seems pretty dangerous to me. For example, NST announced operation difficulties today and ended up suffering a 15% drop in an otherwise pretty quiet day.
For my physical position, I do not keep stop loss, it is a long term investment.
Good luck to everyone,
Branko
No comments:
Post a Comment