Here we are 10 days later:
USERX
2008

2020

Since the last update, USERX fell another 14% and is now -44% down (-50% in 2008) from the peak. We are in the 21st day of the crash. The crash of 2008 lasted for 24 days. Out of 21 days so far we had 7 days where the drop was 5%+ (8 in 2008) and 4 of them were 10%+ (5 in 2008).
The only index in play right now is the long term 218-222 and it is on the sell signal. If it buys back it might signal the bottom.
I am definitely expecting some kind of a bottom in the next few days, probably by the end of the week.
GLD
2008

2020

While USERX crash so far follows the 2008 crash pretty close it is a bit different for GLD. The price pattern is almost identical but the percentages are quite mild comparing to 12 years ago. It is the day 8 of the crash (10 in 2008) and GLD is down about 12% (21.5% in 2008). So far there were no 5%+/day falls (5 in 2008). If the pattern is analogous to the 2008 pattern the crash should have been over already. For the next two weeks, we should have a sideways move followed by a minor lower low. This possibility is corroborated with the 92-96 buy signal generated today which is on the path of trades but xxed. However, if GLD manages to stay above 138.27 for the next two days it will transform this buy signal into a full true bull buy.
I am at the moment 70% in, mostly physical gold and silver. Last week I have done a lot of short term trading but am looking to buy some positions back that I will stick to for a while
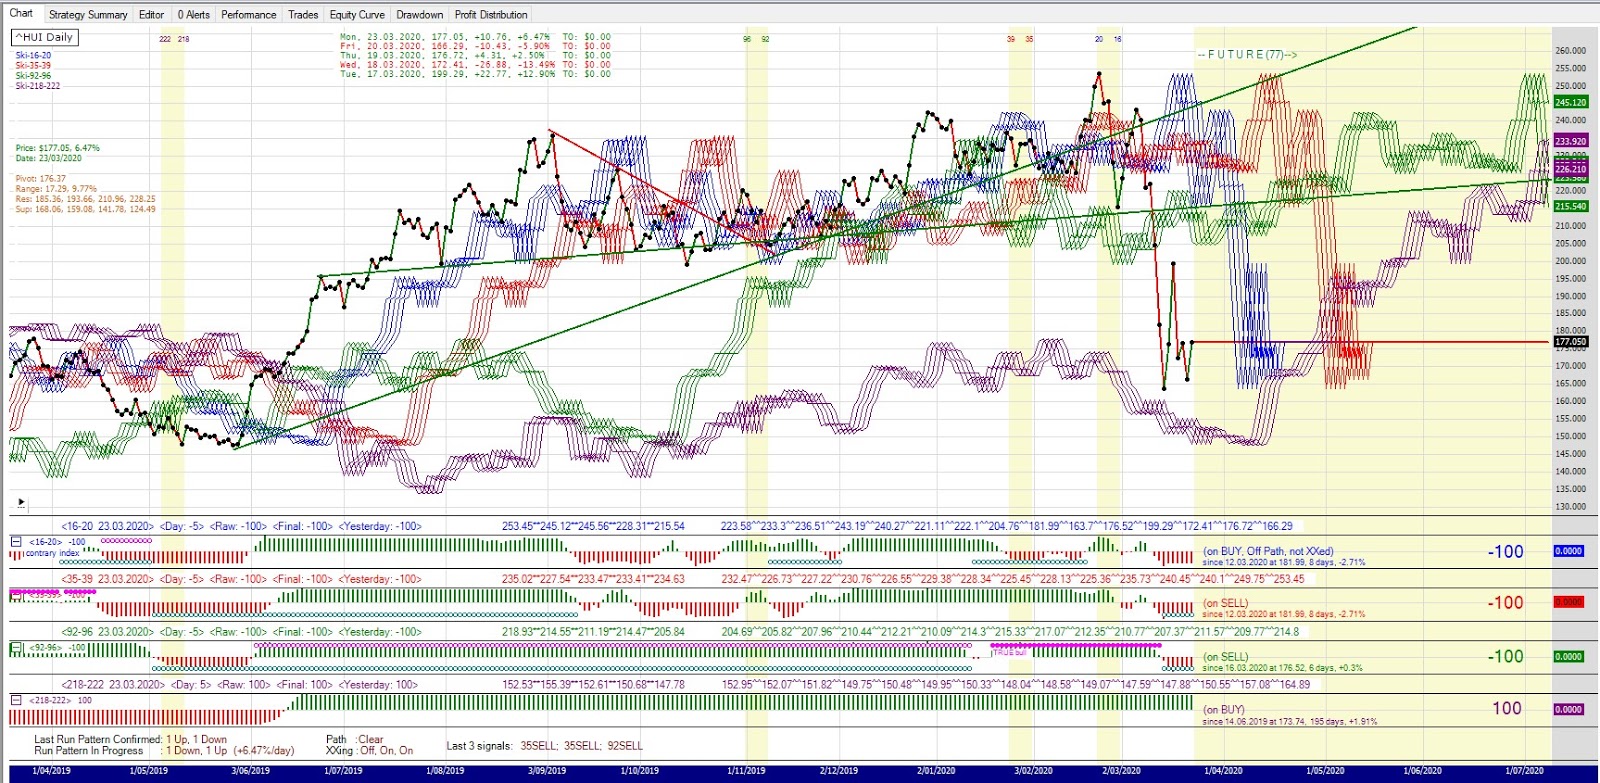
HUI, XAU, GDX and GDXJ
These indexes have not sold the long term 218-222 index. The exception is GDXJ which did sell.


S and P 500
S and P lost 34% since the peak at 3386. Some kind of a low, at least short term, is approaching and we should probably pay attention to behaviour around the long term 881-885 index.
standard

long indices

TLT bonds
TLT held on its double buy and seems like the bottom has been in place. The trend has been intact.

UUP dollar

UUP has generated a double 35-39 and 92-96 buy signal, executed 2 days ago. It has happened in synch with breaking through the 2008 high which had been the most important resistance during the last 6 months. I suppose this is very bullish for the dollar.
BITCOIN
After selling the 92-96 true bull signal Bitcoin is back in bearish constellation but so far that signal has marked the low. The price is up 19% since.

I am pretty relaxed with my position because I managed to avoid a huge drawdown by switching from shares to physical. I am slightly up on my gold position and down on my silver position but nothing to worry about. Also, short term trading in high volatility has been quite good for building additional cash that I want to deploy when the bottom is in.
Good luck to everyone
Branko
No comments:
Post a Comment