USERX
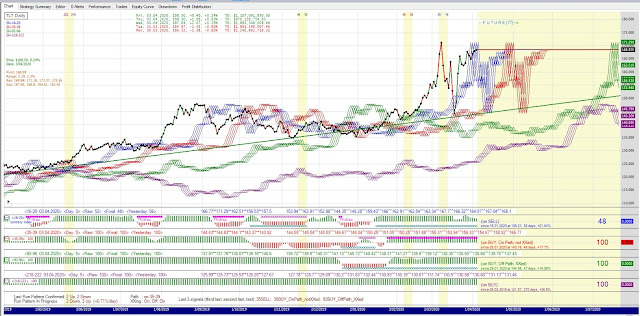
Last week I stated that moving sideways would be the most desirable scenario and the good news is that that is exactly what took place. The current low has been forming at around 218-222 index which currently echoes the bottom of May 2019. A coincidence of this kind is always important. The closing price had breached this low but it has recovered since and is looking promising for the longer-term support. Potential for problems lies in a possible 218-222 sell, which would be a sign of the support failing.
GLD
GLD chart is more significant setup than the USERX and together with the dollar chart it is painting a potentially dangerous situation. GLD is on a double buy 35-39/92-96 true bull signal that is 7 days old. The important levels to monitor are 16-20 index, 35-39 index, breakdown level from 2013 and the trend line from 2019 low. A confluence of such important levels implies a significance of the resolving action of the next week or two. The next signal will be a 16-20 sell which is required for a bullish case but it will create a possibility of a double 16-20/35-39 sell. This double sell would be of the lower order than the current double buy but would create some uncertainty especially because the current price is hovering around the important 2013 breakdown level, which is a major resistance that needs to be overcome. The trend line emanating from the May 2019 low is also in play and it would be broken if the 35-39 sells.
Knowing how difficult recently SKI indices were to interpret I wouldn't be surprised to see a double sell just to be negated with a double buy after many traders got knocked out of their positions .
The best case scenario is obviously a 16-20 sell followed by a breakout over the recent high (159.37) but that would be too easy, wouldn't it?
UUP dollar
Let's observe the chart that illustrates all complexity of trading technical charts but also shows how great SKI and other technical indicators are in marking significant turning points.
In the end of September 2019 after a prolonged bull market, the UUP approached the October 2008 high and was rejected in a decisive manner. In November, it generated a double 16-20/35-39 sell which was bearish and led to the test of the support represented by the 92-96 index and the long term uptrend line. The test resulted in the 92-96 index selling in December 2019 and it all looked very bearish especially because the long term trend line gave up too. Contrary to all odds an unlikely rise ensued the rise lasted till February 2020. The price peaked just 2 days before USERX peaked, which marked the beginning of the market crash. The top coincided with a touch of the 92-96 index. It all looked uber bearish again and the price collapsed to simultaneously break down through 35-39 and 218-222 index. Then again the unlikely thing happened because instead of the breakdown the day of the 218-222 sell marked an exact low. The price immediately exploded higher to smash through till then impenetrable 2008 high, then fell back to back test it and then created a powerful true bull buy signal.
Meanwhile, the GLD and the TLT did the same and they are now in the same position as the UUP. The big question now is can all of them be right and if not which one is fake? Is the Dollar Milk Shake Theory playing out or the dollar and gold are going up together? If only I had a crystal ball.
TLT - bonds
TLT had a bit less dramatic journey than the GLD and UUP but is also in a bullish constellation and it seems poised for a further rise. Some healthy consolidation at the current level or lower until the 16-20 buy would be ok.
SLV - silver
Silver needs to regain the 218-222 index level before it can try to get back in bull territory.
S and P 500
The next S and P signal will be a 16-20 sell and that would be the point to short the market. It is interesting to notice that in 2008 this first thrust up didn't manage to sell the 16-20, the sell came a month later after the initial low was broken. We'll see what happens here.
XGD - Australian gold index
Australian gold stocks need to rise over 6200 quickly and keep rising to buy the 92-96. There is a potential for a bad double sell in 10 days. This setup corresponds to the GLD setup and is worth paying attention to.
HUI, XAU, GDX and GDXJ
All similar to USERX
HUI
XAU
GDX
GDXJ
Bitcoin
Still in a bear constellation. There is a long way to go before this chart turns positive.
I am 70% long mostly physical gold and silver. I am trading miners but not keeping long term positions. I bought a sizable SLR position this last Friday, I will sell on a rise or if the stop loss is hit.
For my physical position, I do not keep stop loss, it is a long term investment.
Good luck to everyone.
Branko


No comments:
Post a Comment