I'll cut to the chase, the Australian gold index XGD is triggering a very rare and powerful triple buy signal today. It is happening while USA gold indices are buying the 35-39 index while on a true buy 92-96 signal. Also, on the traditional TA charts, the XGD is crossing its 50 day MAV, which corroborates the above. My stop loss is still USERX 92-96 sell signal.
The gold market has shown its wild nature jumping up and down 5-10-15% a day showing why it is so hard to ride the gold bull market. A week ago I was totally calm and happy being 100% long and far from my stop loss (92-96 sell) and then in literary 2 days my main holdings were down 25-30% and seemed like an inevitable stop loss will be hit. Since May 2019 when the gold bull started in Australia I have been between 50% and 100% long but since the day one, I have been telling to myself that before the real thing starts there will be a day I will want to sell everything. I have been doing this in order to prepare myself to be strong hand at the extreme moves up or down. In December 2019 I was ready to sell but I held on easily. On the 24th of Feb all my initial targets for the bull have been hit and I decided to trim 20% of my position and I did the same the next day. Then the meltdown started and instead of buying back, as planned, the brutal selling made me really feel an urge to sell everything. I was ready for 20% drawdown over a few weeks or so if needed but I sure wasn't ready it to be over in one day! I surrendered and sold another 30% at the bottom. This is normal for me and I learnt over the years that it happens. The good thing is I didn't sell everything and bought the 30% quickly back. I lost some money on this quick flip flop but it is nothing crucial it is just very annoying how one cannot go against his own nature.
Today in Australia we have a rare occasion to witness a super potent triple buy! It is almost inevitable and I will be buying my 40% long position back. This time most of it will be physical gold because I am not sure how sustainable mining operations will be in a pandemic environment that is unfolding all around the globe.
I'll start with Australian gold index XGD
XGD bull market started 6 months before the USERX, also, it has sold it 2 months before the USERX did and I hope that this triple buy is a harbinger of what is coming in the near future. The time is up and a strong move up or down is due very soon. I am 50% in physical gold and 50% in Australian gold shares (SLR, PRU and RMS mainly, some risky small caps too).
USERX
USERX barely survived the panic sell-off at the end of Feb. It is not out of the woods yet and will need to go back above that 10.28, the peak of 2016, which is the significant technical level here.
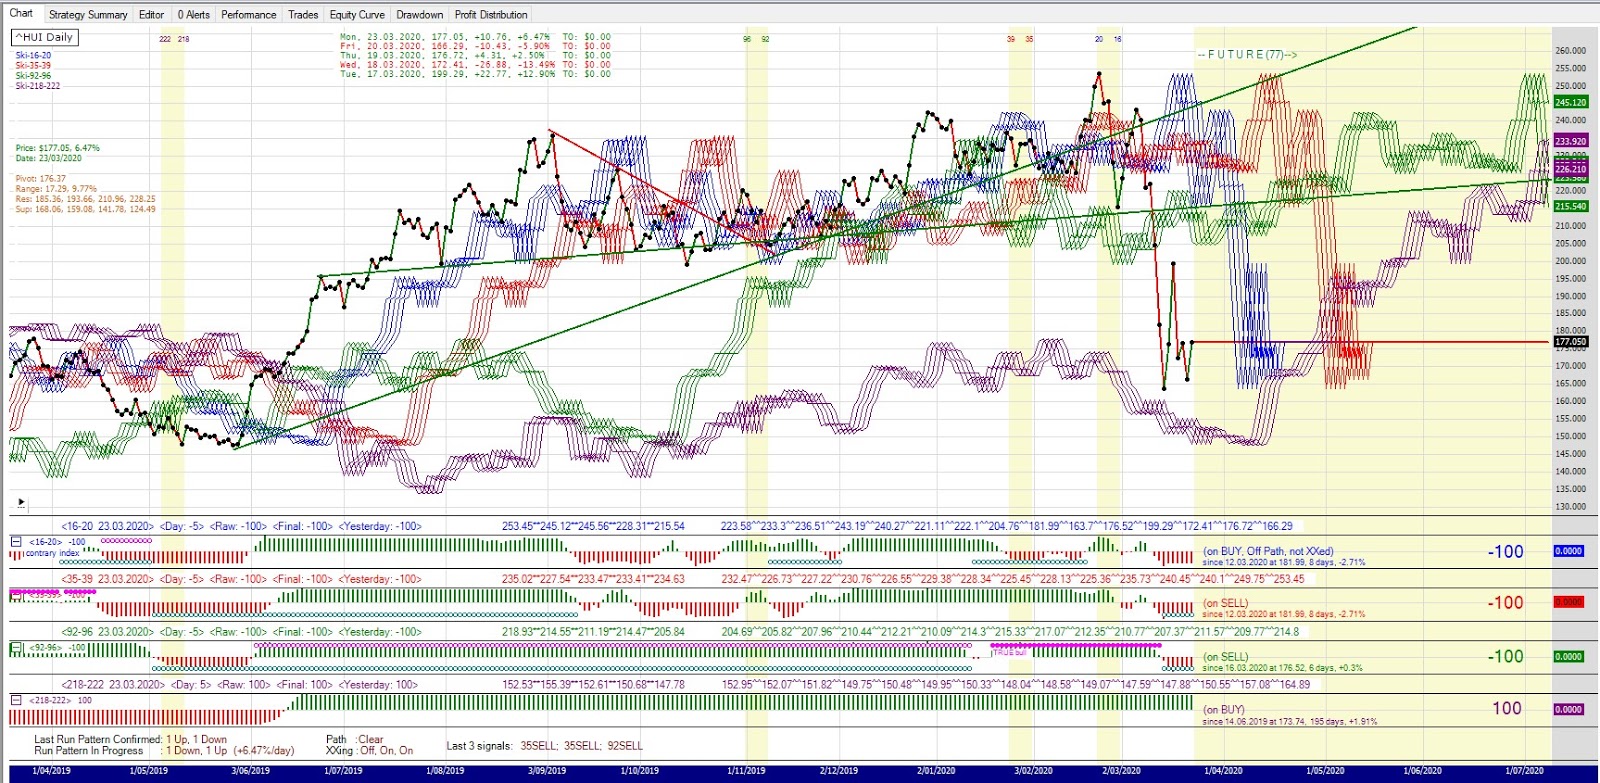
HUI, XAU, GDX and GDXJ
These are all buying back or already have bought back their 35-39 index while on 92-96 buy signal. It is all bullish for now but considering kind of moves gold could do in the next few weeks I will certainly not fall asleep at the wheel again.
GLD
GLD is at the new high and looks perfectly healthy. My position is now 50% physical gold and silver.
SLV
SLV is on a double sell and will need some significant effort to overcome the resistance. Considering that silver is normally lagging gold in the early stages of a bull rally it seems ok for now.
SandP 500
SandP has sold the 35-39 and broken traditional levels of support but the 92-96 is still holding. How long we will see.
SandP crash monitor chart
I have been monitoring this chart for a long time. It is supposed to signal when the S and P 500 goes into a crash mode. Check what happened the last two times when 36 months MAV was breached on the monthly chart. For now, we are fine, the critical level is 2774, after that watch out.
TRAN Transport index
This is one horrible looking chart. The price is back at the Jan 2019 level and all indices sold at the same time. Since the price never reached a new high the Dow Theory sell signal is now confirmed. The recession is around the corner.
Russell 2000
Russell is mainly American market companies and opposite to the mainstream media spin, it hasn't been doing so very well as it was propagated. The market never reached new highs and now has sold all the major indices. This is a chart in a bearish constellation.
TLT bonds
It seemed for a while that bonds and gold have decoupled but it was just temporary. They are in synch again and behave like a safe haven destination for capital.
UUP dollar
After finally selling its 92-96 bull two months ago UUP rallied to challenge the 92-96 index and the 2008 top again but failed. It is on the verge of dropping through the floor and giving up all support. If it doesn't rally very soon it seems pretty dangerous for dollar holders here.
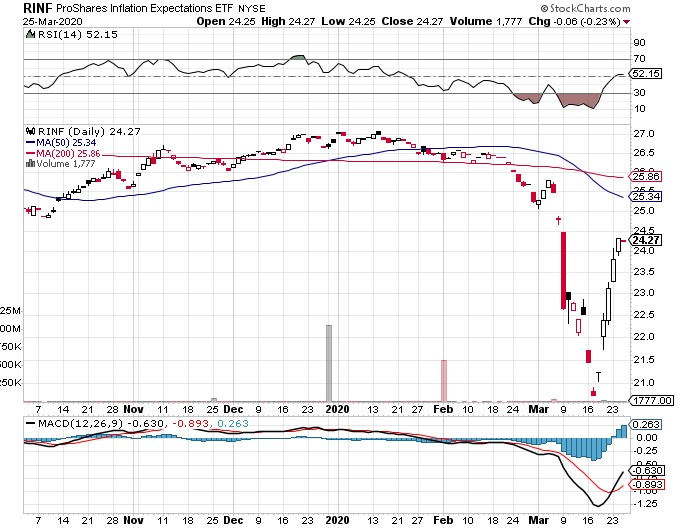
Inflation
The recent meltdown was driven by the liquidity crunch. The inflation chart is still in bullish mode but it needs a turnaround to preserve it.
Bitcoin
Bitcoin has been on a true bull signal for a month. It hasn't gone anywhere for now but it looks promising.
I am long 60% and adding to a full 100% today. My stop loss is a USERX 92-96 index sell.
Good luck to everyone,
Branko