USERX
USERX couldn't overcome the last two interactions with the 16-20 and the 35-39 echoes. It is now about to sell the 35-39 again. In my 'Under The Hood' update from 13.10.19 I explained how the USERX 8.10-8.20 area had been the most important obstacle to be overcome for the last 7 years. It was attacked 6 times before it gave up and become the support. Based on this I expected this level to be tested and projected that USERX price could fall down to this area (probably briefly violating 8.00) before a turnaround and the new 35-39 buy signal. A month ago this would be super bullish development because the 92-96 echo was far enough. Unfortunately the unexpected happened, we went up to buy the 35-39 first and then with the recent development I think that we are back to the original scenario. The problem is we are much later in the cycle and we might sell the 92-96 bull. If it happens I think it would mark the bottom and we wouldn't breach this bottom again before the bull reinstates itself (1). If the bottom happens first (at 35-39 buy) and the 92-96 sells on the way up I would than expect that the 92-96 sell would mark the resistance and we would see new lows before the uptrend resumes (2). There is also a possibility to turn around before the 92-96 sell and rocket up for 3 months and save the bull (3). I don't believe that is very probable any more.
I personally would prefer an immediate hard fall to sell the 92-96 now.

USERX long indices
The 881-885 echo is the border between the bull and the bear market therefore this chart is showing the importance of the 8.00 area. If it gives up it could be bad for the bull for a long time.

XGD Australian Gold Index
It turns out that the Australian gold stocks selling the 92-96 echo last week meant the Aussie stocks were still leading the USA. The Friday carnage in Australia felt like a capitulation and at least a temporary bottom should be in place very soon. If the USA gold stocks fall hard next week I will be looking for Aussies to hold as a sign of the bottom being put in place. This chart is the most important one to keep an eye on since it has been a window into the future of the USA gold stocks for about a year now.

GLD
GLD looks like it wants to visit that 92-96 echo around 133-134. If that happens the GLD still has a better chance to uphold the bull posture than the USERX. If the bull stays alive I suppose that would be positive for a possible longer term bottom for the USERX.

GDX
Same as the USERX except it is a little bit tighter.

GDXJ
Same as USERX.

SandP 500
SandP clearly has broken out and there will be no important events until the price comes close to touching the 16-20 echo. We need a failed 16-20 buy before anything bearish could be considered for this index. The only negative for now is the Dow Theory, e.g. non confirmation of the Transport index.

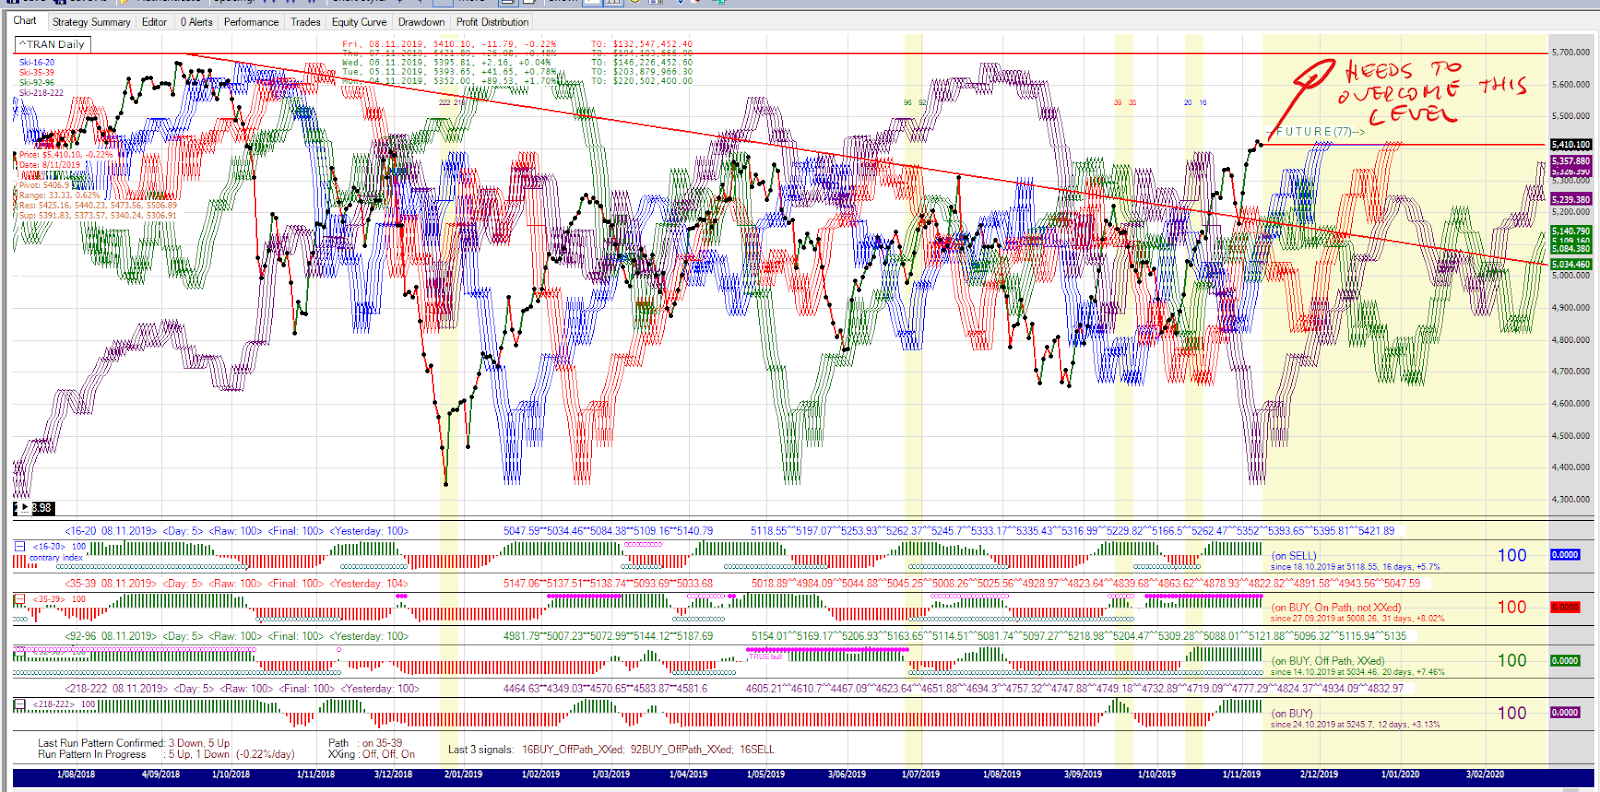
Tranasport index
As I said above, according to the Dow Theory it needs a serious rise to confirm the new bull market for the GM.
UUP - dollar
UUP bought back its 35-39 and is about to sell the 16-20. It is all happening while on the 92-96 bull buy so it should be a signal of a new up leg. The only obstacle on the way to new highs is the Oct 2008 top that couldn't be broken 10 days ago. I expect a visit to this area soon. If it coincides with the hard drop in gold and then gets rejected it could be a signal of the gold bottoming. Also, if the gold bottoms and the UUP breaks out it could mean that gold, dollar and bonds are back in sync. Unusual but it has been working for some time.

TLT - bonds
For a short time it seemed as the gold and bonds were decoupling but now it looks like they are still in sync and, the same as gold, the TLT wants to test its 92-96 echo.

UCO - oil
UCO failed at generating a triple buy after it had executed a true bull 92-96. Now the bull has sold and the best case scenario still can produce a good double buy but will it have enough energy to do that?

BITCOIN
Some people wanted me to show a SKI chart for the Bitcoin. The Bitcoin is clearly in a bear market and currently on an xxed out 35-39 buy. For this chart to turn bullish the price would need to overcome a clear down trend that started in Jun 2019 and then buy the 92-96 echo.

I am still long, haven't touched my position yet. I am hoping for a quick and hard drop next week (scenario 1) and the 92-96 sell where I would go all in, which I almost never do. If a rally follows I will take off my reserve cash on a 16-20 sell signal and adjust as we go depending on the scenario that unfolds. My sell stop will be the bottom that forms around the 92-96 sell. Scenarios 2 and 3 from the first chart above will not cause me to change my position for now.
Good luck to all.
Branko
No comments:
Post a Comment