Wednesday, 31 October 2012

Back in the game

A month and a half ago I sold my position down to 25% long and have been waiting for the correction to run its course. If my theory that the market is in a major leg up is correct then it is time to look at the charts again. 


HUI
It has been 25 trading days since the top has been put in in gold stocks. That is 62% of the last rally which lasted for 40 days. The price is approaching the 35-39 echo and is on a 16-20 buy signal. The 16-20 buy is 12 days old and is 2% in profit which is appropriate for the bullish picture. The 35-39 should prove to be the main support. In a true bull environment this would be the time for the price to start moving up. It doesn't have to be an explosive move but the bottom should be in or reached in the next few days.

GLD
The 35-36 is being touched while 221 is buying. The $165 level was the breakout and is now being tested. If successful it should signal the next leg up.

SLV

This was the most important chart to identify the change in direction and the potential of the last big market rally. The 32 level was the breakout level into the bull market. In the current picture this level and its importance is represented by confluence of three important indicators:
-the 35-39 echo that has just sold at 31.27. This should represent the support.
-the 221 echo that has bought 2 days ago. This buy has a proper bullish alignment and also should represent the support.
-the long term support/resistance trend line (red)  that is currently standing at around 32. Since its inception the SLV is oscillating around this trend line and every significant move up or down has started by confirming breakout or breakdown of this line. You can see how the recent true bull signal coincided with breaking through this trend line and how it is being tested now.

UUP

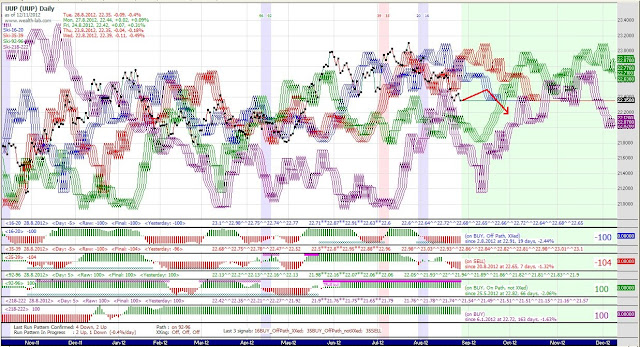
My last update was titled 'Has dollar bottomed?' and yes indeed that was the bottom. The ensuing rally was week and not what I was going for. I would be happier with a sharp move straight into the 16-20 sell and then a 221 sell for a double sell and then a strong continuation of the down trend. The way it has transpired it is not quite sure that the correction is over, e.g. we might be looking at a double bottom. If that is the case the question is how to reconcile this with the the HUI and the GLD chart? My take would be more sideways/down for the GLD and a relative strength in gold stocks (sideways).

SandP
SandP is on a true bull and is testing the breakout. It is down to touch/break the 35-39 echo which should prove to be the support if this is really beginning of a move up.

Aussie gold
Aussie golds confirmed the bottom after buying the 92-96 echo. The bottom was in the form of an inverse H&S and is now testing the neckline level from above. I am beginning buying at this level. Bought this week EVN, RSG, OGC and KCN to get back to 50% invested. I will be adding on weak days until fully invested. No stop loss for now.


Thursday, 20 September 2012

Has dollar bottomed?

Just a short update today. It seems to me like the dollar bottom is near which should put a temporary cap on the rise of GLD and SLV too.

UUP - dollar long
The dollar chart collapsed into the 92-96 sell and then even further to 218-222 sell. The 218-222 bought back the next day and I think this should be the bottom  for a few weeks. It is more probable to first touch the 16-20 echo than to exceed this low on the closing bases. If I am right this should limit the gold rise too and consequently the gold stocks.

UDN - dollar short
Sometimes it is easier to get perspective from the opposite view.


GLD

HUI

Aussie golds
So much potential. 


I am 25% long and waiting for a correction.

Thursday, 13 September 2012

The race is on

All my targets for the gold bull market setup have been met. Today's move finalised the setup in a rather perfect fashion and it is time for me to take some profit from the table. I will do it in two steps, Friday and Monday trading day in Australia. I think this move will go higher (HUI 550) but I am happy to reduce my position to 25% long and watch the final push with minimum exposure. I am a long term investor and I will not be in cash at least till 710 days after the May bottom. My exposure will vary from 25% to 100% long and I will often rearrange my portfolio along the way.

HUI
The HUI broke today out of its downtrend line from the 2011 top. The consolidation that I expected around 485-495 didn't last much (I was hoping for a 16-20 buy) which shows that this leg up is very powerful and it could last longer than expected. The main point is that it has proven its impulsive nature and it has signalled the start of a new bull.

GLD
The breakout is confirmed and it is now running into some resistance. I think it will under perform the HUI in the weeks ahead, which is normal at this stage.

 SLV
Up 22% since the 35-39 gave up resistance. What is going to stop it? Probably 36 where some confluence of resistance exist.

 SP500
Repeat from the last week again '... considering the prevailing negative sentiment and the action of the SLV chart I think there is a good chance that after some consolidation this chart breaks north to test the 2008 all time high...'  

 UUP
How do you call this chart pattern? A limp d**k pattern (copyright Branko 2012 )!
It is selling the 92-96 true bull here. It is time for some rally, probably to a 16-20 sell.

GDX
On a true bull and, same as the HUI, still some room left to the upside.


GDXJ
It is on a 92-96 buy and facing some resistance here.


Aussie gold index
It is buying 92-96 today and still has a lot of potential. Next two days I will reduce my position to 25% long and then will be very aggressive buyer when it is close to the green uptrend line.


Good luck to everyone!


Friday, 7 September 2012

On track

In my last two reports I analysed what was needed to get the gold market in a bull constellation. In short the steps are: extended drop to get echoes in proper alignment, failed 16-20 sell to signal the bottom, an impulsive rally to buy the 92-96 and confirm the bottom, a breakout. In any particular application of these rules I will also mix in traditional TA resistance/support lines and reconcile the whole picture with them.

Lets comment on the development over last couple of days.

HUI
The bottom has been confirmed from both aspects, SKI and traditional. The close at 470.36 last night has done two things: 
  • it has confirmed the bottom from the traditional TA point of view (in line with SKI that already has done the same). It secured a higher high in addition to a higher low that is already in place.
  • Last time I wrote about a possibility of a triple sell if we headed straight down to buy the 16-20 echo. This possibility is now gone, it is not possible any more. The 16-20 is now quite far above other two echoes and PROTECTING the vulnerable spot where the 35-39 and the 92-96 meet. Also, the 16-20 is perfectly positioned to act as a support when 460 level gets tested from above. This is what I call a bullish market structure. There are no week spots and all critical junctures will be supported by this proper index alignment. The other case would be structurally very weak and prone to a failure. 

 What is next for the HUI? Now that bottom has been confirmed the only thing left is to break the trend line at around 480-490 (the SKI breakout has been confirmed). I expect the first touch of this area to produce a significant consolidation that is eventually going to be terminated by a 16-20 buy. This touch is not a requirement though, the consolidation can start at any time.

SP500
Instead of a comment I will just copy a sentence from my last report '... considering the prevailing negative sentiment and the action of the SLV chart I think there is a good chance that after some consolidation this chart breaks north to test the 2008 all time high...' 


SLV
Since its 2 months bottoming process had finished by issuing the 35-39 buy signal SLV has done everything perfect. It is up over 15% and looking healthy. The bottom is in and there is nothing weak in this chart. Is the 92-96 going to transform itself into a true bull or not is not so important. A correction would be healthy. 

GLD
The GLD chart, same as the SLV, looks like a complete breakout. 

UUP
The deeper the UUP goes into that whole below the harder will be to get out without selling the 92-96 bull. It already looks quite impossible.

Aussie gold
I said before that I expect this chart to buy its 92-96 echo in the form of an inverted head and shoulder pattern. Everything seems on track for now but it should be noticed that for Aussies the bottom is not confirmed yet.

I am still 50% long and now very calm to face the correction that inevitably must  come. If we visit HUI 485 first I will reduce to 25% and wait for the 16-20 buy to reload. If not I will go from 50% to 100% long on the test of 450-460 area.


Tuesday, 28 August 2012

Setting up a gold bull, part 2

We have seen last time what was needed to set a gold bull market in motion. Lets follow through on the last week analysis and see where are we in the process and can we still say that this thing is developing in the right direction.

SLV
Two days before the SP500 generated its 92-96 true buy signal the SLV generated its true 35-39 signal. This signal came as a result of a failed 16-20 sell while overcoming a long term resistance from the April 2011 top and, also very important, while being on a bearish 92-96 sell that couldn't produce any downside.   I concluded that it seems the resistance has been broken and the odds are that the SLV is going to accelerate north. The odds worked favourably and SLV moved up almost 9% since then. I expect it to move further up to over 30 and stay there for a 92-96 buy signal. 


SP500
Beside three failed true 92-96 signals in the last two months the SP500 kept stubbornly grinding higher to generate yet another true 92-96 signal. It has happened on the 96th day after the April 2012 high and at the April high level. Given the timing, the price and overbought technicals it looks like a top. On the other hand, considering the prevailing negative sentiment and the action of the SLV chart I think there is a good chance that after some consolidation this chart breaks north to test the 2008 all time high.
The other option is that precious metals are disconnecting from the SP500 and they will rally while the SP500 is going into a dive. Considering the state of the dollar chart I think that this option is less probable.

GLD
The GLD has bought the 92-96 and has reached the April down trend line at the same time. It is trying to break out and it will if it closes above 162. However , it doesn't have to happen straight away, a steady sideways move for up to two weeks will do the trick. Selling and buying back the 92-96 along the way would be just perfect. 

UUP
For 65 days from its inception the UUP true bull 92-96 buy didn't manage to produce any decent upside. The 16-20 buy failed twice, same as 35-39 buy. This is not confirming behaviour and I expect this chart to drop further to test the 92-96 support. In the short term (2-3 weeks) it could go sideways/up to touch the 16-20 from the downside before it resumes sliding down.

HUI
The stage three of a true bull set-up has been achieved for the HUI, the 92-96 buy. There is a disclaimer though, beside coming very close to it it couldn't clear June high of 464.76 but I expect it to be done in the next couple of days.
The HUI setup is a bit different when compared to the SLV and the GLD.
The SLV clearly broke out of its May 2011 top down-trend but it has to go further to reach the 92-96 echo before it can try to break free.
The GLD has reached the down trend line and the 92-96 echo simultaneously and trying to break out.  It has bought the 92-96 but still needs to close over 162 to break the trend line. It would be nice to see it happen in the first two weeks of September.
The HUI, on the other hand, bought the 92-96 but is still far away from its down trend line which is positioned around 485. I think that proper positioning for the HUI break out requires it to reach this 485 level before a serious consolidation takes place. This resistance line should then stop the advance until the next 16-20 buy signal comes into the picture. The scenario that we should be cautious about is if we go strait down for the next ten days to below 422.47 without breaking 464.76. In this case there is a good chance we would get a double 16-20/92-96 buy but that will open a serious possibility for a triple sell next time we reach HUI 450. I don't like this possibility because structurally it is bearish.
The conclusion is that once the HUI 465ish has been broken it will confirm that the initial leg up out of the bottom was an impulsive wave. That is in accord with the premise that the May low is a long term low. The ensuing long term rally should last at least 710 trading days.

On the premise that this leg up should set the stage for a gold bull I think that the HUI has some unfinished business around 485. For that reason I am still 50% long. I have restructured the holdings to get rid of shares that reached the targets and replaced them with those with more potential. If I am wrong and we go straight down to 16-20 buy I will sell when we reach the current level again and then wait to see if we are going to avoid a possible triple sell. If I am right I will reduce my position to 25% long at HUI 485 (optimally 495.70) and wait for the 16-20 buy to go long 100%.


Friday, 17 August 2012

Setting up a gold bull market


Long time ago I have written an article on the structure and dynamics of the gold bull market as I see it through the glasses of the SKI indices. The proper setup has a few stages:
  1. Proper index alignment: 16-20 bellow, 35-39 in the middle and 92-96 on top. To achieve this order the price has to go down for an extended period of time, usually a couple of months.
  2. Forming a bottom. The bottom is signalled with a failed 16-20 sell signal.
  3. The third stage is a confirmation of the long term bottom. It is manifested as a rally that has the structure of an impulsive initial wave up. A proper confirmation rally will buy the 92-96 echo because without this buy the true bull is not possible. I want to keep it simple so I will not go into technicalities of this requirement.
  4. The next stage is a breakout. It is made of a quick 92-96 sell and a rebuy. This event is a proof of strength of the impulsive wave and the measure of its quality is the absence of a 35-39 sell.
  5. After the successful breakout the price moves up while the 92-96 is dropping hence they are forming a ‘scary’ picture where it seems like the price is lacking a firm support. This picture represents the scepticism that should be predominant sentiment throughout the whole move until the bull is widely recognised.

Let’s now analyse some charts while having this description in mind.

Aussie gold shares index

So far this chart is satisfying the criteria to setup a bull market. It had had a 21 month long correction that has put indexes in the right order (stage 1). Along the way it had numerous failed true 16-20 buy signals until eventually the one at the bottom succeeded. The sell signal that ensued failed as it should (stage 2). This signal was followed by a 35-39 buy executed yesterday. This pattern signalled a bottom but we need the price to rise to the 92-96 index/echo and buy it to confirm the bottom and to confirm the impulsive nature of this initial rally. Quite a long way to go compared to other gold indices like HUI but the Aussies were hit the hardest and they have to work the most for the proper recovery. If the 92-96 is going to be bought on this move up, I think it will be around $5500 and in a form of an inverted head and shoulders pattern. That will reconcile very well with the traditional TA support/resistance lines as it can be seen in the picture.
All of my holdings are in Aussie stocks and I am very happy since they are in profit between 20% and 40%. For most of them there is another 10-20% rise before they will be able to confirm the bottom.

HUI SKI

The HUI is similar to Aussie gold stocks except the bottom happened in May and the initial rally was stopped at the 35-39 buy signal. It then had to sustain a drop to a higher low to be able to rearrange the indexes in the right order and then buy the 35-39 again and reach the 92-96 echo. We need that extra push now to buy the 92-96 to be able to setup a true bull market. The resistance exists between $443 and $460 and will be interesting to watch how the price is going to behave while interacting with this range. An immediate push up over $460 and stay over it for 3 days will buy the 92-96 and almost warranty attack on $480-490 before a serious correction.

GLD SKI

While the stocks are leading the rally up the GLD is resting in a sideways correction. Needles to say this is traditionally the right way to start a sustainable gold rally. The price is hovering above the short term indices and approaching the moment of decision. The 92-96 is already set properly for the bull market, we just need the 92-96 signal. By mid-September the time will be up and I expect the volatility to increase dramatically after that.

SLV SKI

The same as GLD except it seems like it has already overcome the resistance from the May 2011 high and is about to move quickly to $30 to test the 92-96 resistance. Check how it, since the 28th June low, has been almost glued to that long term support line. While doing it, it was also working the short term indices so we have the failed 16-20 buy signal and now the 35-39 buy executed yesterday. I think this should accelerate now to challenge the 92-96 echo soon.

S&P 500

Ok, here is the problem. What to make out of this chart??? I have analysed it in previous updates to come to the conclusion that it doesn’t look good. It has generated three failed true bull signals on the way up which normally indicates a rollover top. Surprisingly it has managed to move even higher and reach the top of the previous medium term rally and is about to give the fourth true bull signal. The problem with this is that this time it happens that the 92-96 echo has the right structure to allow for this signal to survive because it will be in a sharp fall for about two months. The 16-20 and 35-39 will act as a support and there is a chance that we will see higher prices from here. If tonight S&P generates a 92-96 true buy signal it will happen exactly on the 96th day after the April high. These kinds of coincidences always mean something important. Is it possible that we see some kind of a melt up in the S&P price while gold is setting up a true bull and then they disconnect and gold goes up while S&P goes down? I am thinking of this possibility just because I cannot really see gold setting up a proper bull if the S&P crashes and burns right here. To remind you the UUP (dollar) is on a true bull but it is not performing well. Maybe the scenario is this: S&P melts up and buys for a true bull, gold sets up a true bull while the dollar is testing its own. Then, when everyone gives up on the S&P crash (which is predominant sentiment today), we finally see it burning while gold and dollar stay on their bull signals and move up in tandem.

It has been ten years I have been trading gold and gold stocks and this is probably the most interesting setup I have seen so far.

I am 50% long, sitting on a solid profit and waiting to see if we are going to move higher to test the 92-96 echo. If and when the buy is generated I will reduce the position to 25% and try to go 100% long at the end of the next correction. On the other hand, if the S&P crashes here and now and the gold follows I have my trailing stops in place and will let them take me out of the market.

Monday, 6 August 2012

Another positive week ahead?

Some minor bullish development for gold can be spotted among the charts I follow.

Australian Gold Index
Aussie gold chart is interesting to watch because it topped before the other did (Nov 2010) and it went deeper in red than the other did. On the monthly chart it is more oversold than it has ever been since 1997 including the 2008 crash. All my trading  positions are in Aussie stocks, currently 50% long. At present it is on a true 16-20 buy and is about to sell for profit if today closes around $5000. I am not going to sell a single share before I see the 35-39 buy and probably rise to challenge the 92-96 echo. $5433 is the major level and it needs to break above it to establish new long term bull trend.

UUP dollar long
Since I reported last time on this chart its action was mostly sideways but with short to medium term bearish bias.  The true bull signal is not under threat but the behaviour around the 35-39 is not confirming so far. When it seemed it was going to avoid a double sell it dropped sharply to violate the 35-39 echo and sell it for a double sell. It, then, tried a recovery and two days rally produced a new 35-39 buy but it wasn't long lasting because on Friday it collapsed again and it now seems it will sell to confirm a medium term bearish period that should lead to the 92-96 support test. I interpret this behaviour as not confirming the true 92-96 buy from 50 days ago. It is still not too late but this bearish behaviour should stop and it must produce a convincing 35-39 buy that is going to last and lead to a new high. For this to happen Monday and Tuesday should keep it above $22.50.
In my last report I thought that chances were 60:40 for the bullish scenario to develop but now I think this is going further down to test the 92-96 echo. That test would be in line with a bottom in gold and is going to decide if this chart has a potential to transform into a real bull.

S&P 500
Since my last report S&P has had another failed true bull signal but it maintains the up trend and it seems it will be able to follow the 92-96 echo to the top around $1420. What happens after that is the question? To me it still looks like topping out but if it can be at 1420 mark in about a week the structure of the 92-96 echo can give it another true bull signal but this time with a much better chance to keep it alive even if a significant correction ensues. This is  especially interesting in conjunction with the SLV chart which could give a significant buy signal just at the same time when S&P reaches the previous high and produces a true bull signal.

SLV

The SLV chart has shown some serious resilience in the last 2 weeks by avoiding breakdown and slowly building a base for a move higher. It has sold a 16-20 echo but keeps grinding higher so it is now, 10 days into the signal, almost 3% in green. See how all is happening while breaking the resistance line from the Apr 2011 high and touching breaking the 35-39 resistance. This looks bullish and if it buys the 35-39 echo in a week time at the same time when S&P reaches $1420 it could be a signal that the S&P is not going to top out as everyone is expecting. 

GLD

The GLD is moving sideways and breaking the immediate resistance from the Feb high but more importantly it seems stuck in-between the 35-39 as a support and the 92-96 as a major resistance. This can last only till the middle of Sept when it will be forced to break through the 92-96 into the bull territory or to follow it down and break bellow $150. 

The development over the last two weeks seems positive for the bulls. Grinding slightly higher or sideways for another month is setting up for a major decision event in a middle of Sept 2012. I am happy to keep my 50% long position at least until the prices of different indices reach the 92-96 echo. The stops for all my positions are now in place and they are set below the recent lows. For Aussie shares that is mostly July lows. For those interested I have positions in NCM, RSG, OGC and IGR.

Good luck to everyone.


Wednesday, 1 August 2012

My approach to markets using SKI indices

My approach to markets using SKI indices

The way I am using the SKI indices is materially different from Jeff's. My approach is not through the statistics. I have been a creator of many systems based on statistics and have found that a major down side of this approach is that when the market changes direction or there is a new force in the market, that significantly changes the market behavior, it takes too long before it is reflected in averages. Usually, mechanical systems based on pure stats fail in the most critical moment when the best opportunities arise or when the market changes the gear. Simply put they need time to adjust to new conditions. If we take the current bull market in gold as an example, with so many unprecedented events recently, we will probably need 30 years before all what is happening now became a part of the SKI stats. I do not have that time.

I had been looking for years to find a tool that doesn't have this fault and I found it in the SKI concept. I use the word ‘concept’ because I would like to distinguish between a broad abstract idea of the SKI mechanics and the SKI system which, for me, is an implementation of this concept. There is one concept and many possible implementations/trading systems that can use this concept to create a tradable system.

The SKI concept comprises three most important features that you can wish for in a TA indicator:

1)     It is self-adaptable to changes in market volatility. This is because, to produce signals, the price interacts with original price values rather than with average values. The consequence of this is that the SKI indices don't need time to adjust to new market conditions! If the life run low of 2008 was unprecedented, as it was, the next time the price interacts with it in, for example, 92-96 index/echo it will interact with this exact low and its exact amplitude and volatility, not with an average of all life run lows over the last 30 years. For this reason we could assume that any system based on the SKI indices is self-adaptable to market conditions hence very robust and resistant to volatility changes.
2)     It can integrate multiple time frames. SKI concept implements the cyclical nature of markets and humans through 16-20, 35-39, 92-96, 218-222… indices that I call 'echoes'. I don’t like the word index because somehow it doesn’t reflect its most important quality: it is the original price just shifted forward in time. Combining these echoes allows us to construct complex market images with multiple time frames overlaid in one clear picture. I do not know for a better tool to define if the market is in a bull or bear formation.  MACDs, MAV crosses, RSIs… work to some extent but because of their nature (average) are slow and prone to failure in volatile markets.
3)     It eliminates noise while producing a signal. The concept of 5 back prices is a concept of weekly implemented into daily time frame to eliminate the noise. It is brilliant and works very well.


Here is how I work. I deploy SKI and other indices to a desired set of data. I mark traditional support/resistance lines. Then I look for important levels and time periods. An important level is where support resistance line meets SKI echo or two or more SKI echoes converge or a combination of any of these. An important period is where price faces an echo that represents important event from the past (important breakout, top, bottom, trend...). After I have decided where the important levels/periods are I watch BEHAVIOR around them. The third element is the overall sentiment that prevails through media and forums I read. That is it. I do not need 30 years of stats to analyze an unprecedented situation like we had many times since the LR low. The SKI indices are telling me what are the important points and the behavior around them is telling me what TO DO not WHAT IS GOING TO HAPPEN. Mix in a little bit of risk management and there you go.

Thursday, 26 July 2012

Boxed in

HUI SKI


Not much has happened since my last report. The price has been trapped between $391 and $401 trying to carve a double bottom. A bit lower is the very long term support going back to year 2000 and a bit higher are the SKI indices lined up in a bearish formation. For now, $391 held as the support and it seems it is time to trial the resistance above. I think the next signal should be a 16-20 sell and then to get the bullishness back in play we need to reach $450 by September and challenge the 92-96 index. Practically the price is boxed in and it will need a serious energy to break up or down. The importance of this juncture is obvious, breaking down means violation of ten years old trend, breaking up means a possibility of a true bull or a double 35-39/92-96 buy.


I have added to my positions today at the close in Australia and am now 50% long. Recent low is the stop loss and I will trail it on the way up. If we reach the 92-96 index/echo I will reduce the position back to 25% and wait to see the behaviour around it.  

Saturday, 14 July 2012

Results of the poll:


Very interesting results and a bit surprising for me. Pity, only 16 people took the poll out of more than 50 that visited the page. I have no idea if it is of any use but here we go, my interpretation:


Capital deployment
All in
Over 80% very bearish
50%-80% bearish
20%-50% bullish
0%-20% very bullish
37.5%
Bullish
All out
Over 80% very bullish
50%-80% bullish
20%-50% bearish
0%-20% very bearish
18.7%
Very bearish
Partially in
Fuel for bulls and bears
43.7%
Overall
Mildly bearish


Sentiment
We will go up
(we bottomed)
Over 80% bearish
50%-80% neutral/bearish
20%-50% neutral/bullish
0%-20% bullish
62.5%
Neutral/bearish   
We will go down
(we didn’t bottom)
Over 80% bullish
50%-80% neutral/bullish
20%-50% neutral/bearish
0%-20% bearish
18.7%
bearish
Don’t know
Fuel for bulls and bears
18.7%
Overall
Bearish


Other
81.2% people already have some kind of a position. Seems high.
Negative
Only 60% of those who are sure that we have bottomed are   fully invested. The wall of worry?
Positive
50% of those who are not sure what is happening already have some kind of a position. Sign of fear of missing?
Mildly negative
There are three times more people who think market is going to rally than people who think it is going to drop
Negative
There are two times more people who are ‘all in’ than ‘all   out’
Negative
Only 20% took the poll. Absence of interest...considering the importance of this juncture this is probably positive
Positive


All together it seems more negative than positive. The encouraging thing is that people are under-invested compared to the quite predominant belief that we have bottomed. Could be interpreted as a wall of worry. The rest doesn't seem encouraging, over 80% already have a position including 50% of those who have no firm opinion on the current market state. Very easy target for strong hands. Would be interesting to see what is the average exposure of those who are in the market. There are three times more people who believe that market is going up then down. And one more thing, the most interesting, the number of traders that think we haven't bottomed and therefore have no position is ZERO. Again, seems negative but...let's just wait and see what happens...

Good luck to all.

Thursday, 12 July 2012


IS the bottom already in?


Let's examine my favourite HUI chart today and show power of the SKI indices in conjunction with some traditional TA.
Here is the long term chart of HUI with some traditional trend lines mixed in. The two elements to concentrate on are the SKI 884 index (purple) and the entire bull market trend line going back to year 2000 bottom (turquoise line).
On the left side of the chart you can see the bottoming pattern of the 2008. I wrote a lot about it while it was happening pointing out that what you see there is the 884 index echoing the exact low of 2005 and the price action that bottoms at almost the exact day of the echoed bottom. Powerful stuff, isn't it? From this fact alone I drew the conclusion that the 884 index in this case was telling us that it is the line between the bull and the bear market. The other thing that we see in this single picture is the rally that ensued after this point, the 884 index rally and the real price rally. The 884 index rally is not just some rally. The first year of it is the echo of the true bull rally of 2005/06, then the echo of 2006/07 consolidation and after that the rally out of the Aug 2007 bottom into the Mar 2008 top. This period shows us how the price action after 2008 bottom compares with the price action from 2005-2008. Pretty damn good, I would say, and pretty damn similar too. It strikes me that the length of these two events are almost the same, 711 days the 'original' and 719 days the 'copy'!

Now, concentrate on the other important element of this picture, the turquoise line that represents the up trend going back to year 2000 low. The first touch of this line, the one preceding the Oct low represents the life run low. We all remember, and can see, what happened after it but I want you to concentrate on what happened in the weeks following the October low. After the price recovered from the abyss of the October carnage it hadn't tested the bottom again but rather it tested the life run low instead and it did it three times! I also wrote about this while it was happening and concluded that this was telling us that the life run low was for real and because it was coinciding with the exact support line from the beginning of the bull market we can tell that this is the most important trend line of the entire bull. If we accept this and the same thing for the 884 and look back to the picture it is not surprising to see that the 884 is actually oscillating around this uptrend line. Uncanny, isn't it?

Let's do some cycle work now. The bottom of 2008 happened close to 884 days after the bottom of 2005. The recent bottom of May 2012 happened almost exactly at the 884 cycle day from the bottom of 2008. What was the SKI structure at the time of the 2008 low? The price was in between the  purple index (884) and the green index (663). The 663 index is the long term inverted SKI index signalling a support when the price is bellow it (pandan to 16-20). That means, in 2008, the price approached the long term trend index (884) while it was on the shorter term support (663). It is exactly the same constellation today. We are on the shorter term support (663 buy) while we are approaching the very long term trend zone (884). On the top of this it is all happening above and close to the major trend line going back to the very root of this bull market. So, is this an important juncture or what? You bet it is! It is mega important.

Based on the cycle work we might say that there is a possibility that the May low was the bottom and that we are now in a new cycle. If that is true maybe it is not really smart to expect the May low to be violated (as I did yesterday). Maybe the better conclusion is to say that the kind of exaggeration on the sell side that happened after the life run low shouldn't happen again and that the price action is telling us that the gold market today is much stronger than it was in September 2008. The thing that ruins this idea for me is the state of the SP500 (on important sell) and the dollar  which is on a true bull buy signal. So, I still haven't made up my mind what is happening here but here is what I am going to do. If this intra day reversal gets some traction tomorrow I will consider the May was the low and consequently I will put the stop on all my trades at that level and will add on red days until I am fully invested. If we keep going down I will keep my current position without a stop and will be adding on strong down days below HUI 370 till I am fully invested. In the first case the trade should last at least 710 trading days, the same as two previous cycles. In the second case thou, I would consider the trade medium term and sell it when it faces the 92-96 resistance on the way up. I will re initiate the position after I have enough evidence that long term trend line is holding again.

I brought my position today to 25% long on opening in Australia. My feeling today is that if this setup is going to fail it shouldn't happen here. Maybe September is better time when the price meets the 92-96 resistance and everyone is complacent again.

For the end and some fun I would like you to take part in the poll at the top of this page. What do you think, is the bottom in? I will keep the poll results for everyone to be able to see.