Tuesday, 2 February 2021

Danger!

Some interesting signals have been generated and it is important to direct our attention to the way they shape the big picture.
I urge everyone to go back and read the intro of my last blog to understand why I am sending this update in the middle of the week. Markets are interconnected and it is important to see the big picture.

The most important thing first, GLD

GLD
GLD generated the 35-39 sell signal to join all other indices that already have sold. The only thing holding this chart from falling quickly is the support line but that support is getting thinner and thinner. If gold breaks $1800 then, in my opinion, a quick $100 move down will ensue. Every time gold makes a move to break through the resistance, the resistance reasserts itself. $1860 seems like a much tougher obstacle than $1800. To buy back the 35-39 echo, which is necessary to flip the picture to bullish, gold needs an instant surge of 1.98%. That would be around $1880. In my opinion, given the signals, the chances of that are much less than breaking $1800.
Here is the one-hour gold chart. If the neckline on this chart breaks hold your hat.


UUP - dollar ETF
Since March 2020 dollar is officially in a bear constellation (sold 92-96). During this time it couldn't manage to break the downtrend line but now it is one day from buying the 35-39 index on the path, not xxed while breaking this resistance line. Combine that with the 35-39 sell signal across the gold sector and you get two pictures telling the same story. 
Here is a 1-hour chart of USD/EUR, which looks like a breakout from the 2 months long inverse head and shoulders. Pretty strong bullish alignment that already broke out.
Often to get a better perspective of one chart I go to the chart that represents the opposite asset. In the case of the UUP that would be the UDN, dollar bear ETF. That one sold the 35-39 today. Fits the overall picture.
So, it seems that dollar and gold are falling in line, what about bonds and broad markets.

TLT - bonds
I described last time how this chart is very bearish. A further decline will increase the bond yields which is then the pressure on the S and P 500. The SandP is ignoring this for now, but it seems that the gold is not. Probably, the perception is that the FED will intervene if necessary but for now the TLT chart keeps deteriorating. What if the assumption that the FED is going to intervene wrong. Maybe they will let it bleed first and then intervene? Is that what this chart is telling? I do not know but to stop this chart bleeding the intervention is necessary and quickly. 
The mirror view of this chart is TBT bonds bear ETF. It has been on a true bull signal since Oct 2020! That should not be ignored.


S and P 500
SandP rallied the last two days but it didn't generate any signals, therefore, the SKI configuration is still bullish. This chart might be the last chance for gold and dollar to reverse their signals but I think it will need the SandP price to hit a convincing new all-time high to have such an impact.  The momentum is slowly waning. 
To shed more light to this situation lets involve the transport index. Transport index has generated its unwanted double sell index and is now trying to recover but for now, the sell signal is surviving.


Given the bonds situation, the SandP chart and the TRAN chart I would say that the overall bias for the broad markets would be slightly negative for now. Outside intervention is needed to push this thing upward again. 


That is it for now. Time is quickly running out for gold and gold stocks to reverse the action of the last two days. The charts are, for now, favouring the downside.

I am sitting on my core position and will establish a trading position if the charts generate buy signals. I have transferred all my ETF holdings to physical metal. I have established a small long position in the dollar (USD/EUR) and will increase it next week if the signals are not reversed. 


Good luck everyone,

Branko


Sunday, 31 January 2021

The impossible route

My stop loss has been hit and I had to sell. I am down to my core position and fully aware that I might have sold the bottom but there is no excuse to ignore my own rules so I stuck to discipline. 
The basic theses for my using of the SKI indices in conjunction with the classical TA is that the valid signals come simultaneously across different systems and across different vehicles. The idea was born in the aftermath of the 2008 'life run' disaster when the signal failed and USERX went on further 40%+ drop before the bottom was established. After the fact, I was trying to analyze data and find out if there was a method that would have given me the warning that something was wrong with the signal. The answer was yes there was, on 22nd Sept, 12 days after the 'life run', USERX generated a juxtaposed 16-20 buy which was short term bearish but given the context of the 'life run', it wasn't such a big deal. But then there was this other thing, while the USERX and all other gold indices were rejected by the 16-20 resistance, gold itself was generating a very bearish 16-20 and 92-96 double sell! The 'life run', because it is such a specific tool that applies only to the USERX, didn't have much value in comparing it with other indices but the rejection of the 16-20 aligned with the powerful sell signal in gold should not have been ignored. It was a red flag. 
Following this event, I went back and started analysing synchronicity of the SKI signals across the gold indices and later across other sectors and in combination with other methods. My finding was that the SKI indices work the best with the vehicles that have a wide audience behind their trading. This means SKI works well with commodities, currencies, any widely used indices or even some household name company shares like Microsoft or Apple. Also, I found that a good method to bring clarity to SKI signals is to combine them with the traditional TA and vice versa.  
I am saying all this to get to the point which would be to describe the confusion that the last week has incited in me. When I go through the charts I cannot be sure anymore what is happening. The markets are being pushed to the brink but there is still not a decisive signal pointing into one direction so I decided to obey my stops and go back to the core position. 
In my descriptions of the charts that will follow you will see how almost every market is in this dual position where a small move in one or the other direction can lead to two totally different outcomes. 


USERX
USERX price generated a 35-39 sell signal, which was my stop loss level, so I sold. But it is not that simple. Ever since the November low, I believed that the sector is in a 'wall of worry' kind rise that eventually will lead into the new bull market by the first week of February, if not earlier. The only condition for this to happen was for the price to stay inside the rising channel that started back in May 2019. I suggested ignoring all SKI signals while inside this channel. Price obliged and everything looked fine till 20th Jan. The upward and the downward support/resistance lines were crossing on the 20th of Jan and I was pretty sure that beyond this date the only obstacle left would have been 16-20 and 92-96 echo with a setup for a possible bullish outcome either in the form of a single or a double buy signal. The other possible path was the 35-39 sell which would lead to falling out of the channel therefore bearish. When the 20th Jan arrived the price came down right to that crossing point and generated the 16-20 buy signal and bounced back immediately and everything looked fine, support holding resistance giving up. Unfortunately, the very next day the price suddenly reversed and subsequently sold the 35-39 echo and fell back into the downtrend channel. It all looks bearish now but if we zoom out a little bit there is more to it. The November low has been marked with the touch of the support of a lesser degree, the one going back to September 2019 which still could be the limit of this breakdown but this time I cannot bet my money on it because the chart structure doesn't support it. If we, for any reason, jump back to 13.50ish, the original target for the first week of February, we will have a bull market break out. This time though the odds are not on our side. On the other hand, it is only 4.2% rise needed to flip the situation. That is something that gold shares can do at any time in any market conditions even intraday (like they actually did in the last two days). 
As I will discuss later there are setups in other markets that can trigger some serious pullbacks and that is why given the gold signals I cannot take the risk of ignoring them and stay long for another few days until the situation clears. 
The last few days there was increased volatility in the markets generated by different issues: promised but postponed fiscal stimulus, short squeeze scandal, hysterical share price levels of some major companies, repositioning for the anticipated 'Biden economy' policy changes, etc... Given all this, I am not even sure that for the short term outcome the charts matter as much as they normally do. The system is starting to leak water everywhere and I am happy to step aside to see what happens. 
One more thing, my personal feelings went from being worried to being outright scared to be 100% long. This is actually bullish because I often sell bottoms and buy tops.  Luckily over time, I learned to reverse these mistakes quickly if needed.
Important levels to watch: 

on Monday 8th Feb the highest USERX price to beat will be $13.41, higher than that and both 35-39 and 92-96 will buy. The actual buys could, in fact, be generated at lower levels but it all depends on the price trajectory.

If the secondary support line (from Sept 2019) doesn't hold the obvious first target is the lower boundary of the downward channel that coincides with the 38% fibo level of the March rally. That support would be between $11.10-$11.41 (-14% from the current level). If this support doesn't hold the next firm support is 50% fibo from the March rally that coincides with the 2016 high at $10.28 (-20% from the current levels).  The final support is at the 62% fibo at $9.35 but we better not go there because that would sell the long term 218-222 echo and we will officially stop the bull market. 

It is worth looking at the weekly USERX chart as well. I mentioned before how the weekly chart sports a gigantic shallow pan pattern. The left side emerged in 2013 with the breakdown of $13.75, the middle was marked with the 2016 rally to $10.28 and the right side started closing with the 2020 rally above the 10.28 to reach the August high. It all looks technically perfect and healthy. It is obvious from this chart that the difficulty to stay above $13.75 is not by chance, since Aug the price managed to close above this level for only three weeks. Also, it is visible that the $11.74-$12.22 is an area of support. Currently, the secondary uptrend line stays at $12.22 so this confirms that this level is worth watching. The weekly resistance is now represented with 8week and 21week MAV and they are respectively $13.15 an $13.31 which is in line with the breakout level prescribed by SKI at 13.41. 
The same important levels are signalled by different methods so let's see what happens.  


XGDA - Australian gold stocks
Usually, I present the Australian gold index at the end but this time I will do it first because it is so different from all other indices and also since early 2019 it has been a leading indicator at all major junctures. 
Prior to the November plunge, the XGD generated 35-39 and 92-96 sell signal around 38% fibo level and that led to a severe crash much stronger than the USERX and other gold indices. The low was marked with the touch of the 218-222 echo. The similar touch in March has marked the final low so when this one held I thought the worst is over and we will spring back to the upper boundary of the downward channel as a prelude to the breakout. Instead, a megaphone pattern developed inside the channel with lower lows and higher highs. This kind of pattern is psychologically but also technically the most difficult to hold on because it repeatedly triggers stops and breakouts and then instantly reverses. This third lower low triggered my stops. The problem is in Australia everything looks and feels like the bottom. If that is true we should spring straight back to the upper boundary of this megaphone pattern which is currently positioned slightly above $8000 level (+13%). That would be a good omen for the USA gold stocks. A failure to do so will lead to the fall down to the very long term support line emanating from 2015 low ($6500, -8%). Unfortunately, such an event would most probably lead to the sell of the 218-222 echo and that would change the character of this market to bearish. 


HUI
Hui sold the 35-39 echo and is in a similar configuration like the USERX with the most important level $286.05 barely holding. Not a good position and it requires an instant reversal of the trend to buy back the 35-39 echo ($312.05, +10%). 
An immediate lower level target sits at 50% fibo $256.66 (-9.5%). If that cannot hold the next target is at 62% fibo $229.63 (-19%). 


XAU
XAU also sold the 35-39 but instantly jumped back inside the contracting triangle and is sitting at the apex now. A slight move up will trigger strong double buy, a similar move down will break the support at the apex and lead to a strong move down. The time is up.


GDX
GDX is similar to HUI but the support lines have not been violated so the technical picture is practically unchanged from the last week. The all-important 2016 high level is still intact. This is a stronger position than the USERX and HUI.


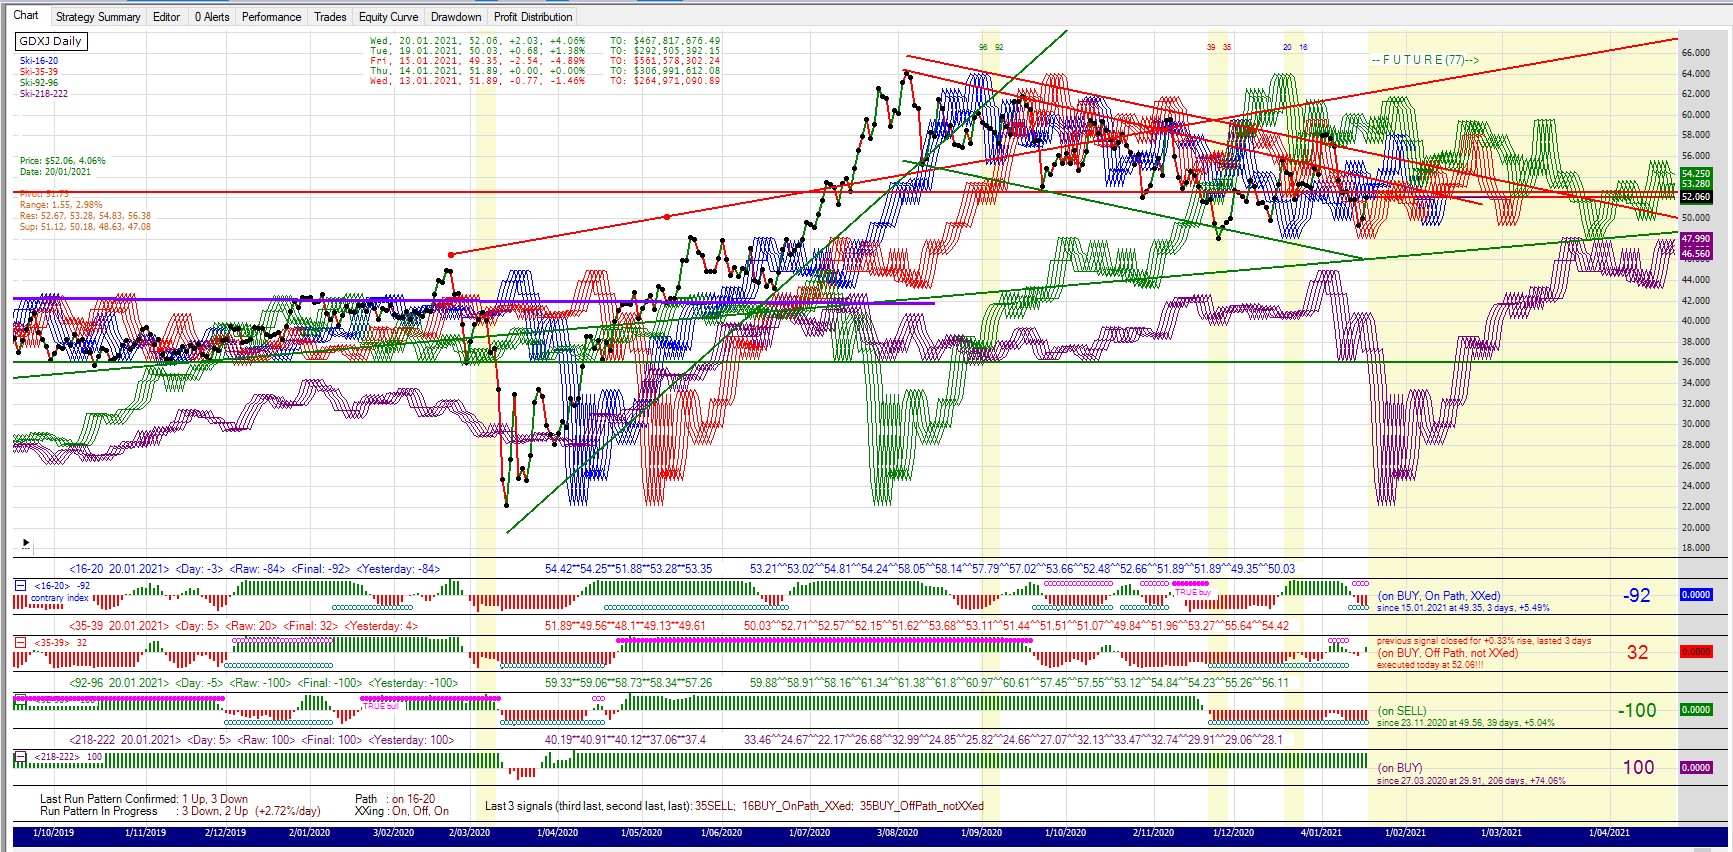
GDXJ
GDXJ is weaker than any other gold index. The 35-39 sell has happened at bellow the important 2016 high which therefore corroborates the sell. On the other hand, the price is still above the trend line and has some more space to move in that regard. Not particularly strong configuration but the bullish setup exists not far above the current level. 


GLD
The gold chart is hanging by a thread. The price is positioned at the very pinnacle of the contracting triangle. There is absolutely no room to wiggle, the smallest move will now produce the break of the triangle either up or down. Above, there is a setup for a double buy, bellow for a quick fall to the lower boundary of the channel. There is strong support at the November low at $166 (gold equivalent price $1777) and the next one at the lower boundary and fibo 62% of the March rally at $158 (gold equivalent price $1690). 


SLV
The silver chart doesn't jive with the gold indices or the gold itself. If nothing catastrophic is about to happen the price of silver is going to buy the 92-96 echo for a potential bull market. The question is if it is going to be on the path of trades or not. That depends if it is going to trigger the buy before or after the 16-20 sell. The preferable scenario is after the sell because then the buy will be a true bull, all in, signal. 
I guess this chart is good news for the gold bull case. The problem is it could be a consequence of the Reddit short squeeze story that has been unfolding in the markets since the last week and it could fizzle out at any moment. It is also possible that it is a harbinger of an explosive move that will blow out many naked shorts out there. It is hard to believe that the Reddit crowd has the necessary energy but the important thing is that this is an excellent illustration of how the charts might be temporarily irrelevant.


S and P 500
SandP is about to buy the 16-20 echo. The last time this happened was in Oct 2020 and it marked the exact low of the short term correction. The problem is that this time the potential buy level is aligned with the neckline on the 1h chart and also with the daily support. If this level is about to be breached there is also the 35-39 echo just underneath it and if this index sells the S and P could be very vulnerable to an instant sharp drop all the way to 3400, the October 2020 breakout level. I think that the S and P is the chart to watch on Monday. If there is a weakness it could break down by the end of the day. Given the recent weakness of the gold and the gold stocks manifested every time the S and P was weak this setup might be a danger for the gold market. 
1h chart

an even better illustration of this setup is the one-hour chart of Tesla

and Apple


TRAN - transport index ETF
As I wrote repeatedly I have been watching this chart for the confirmation of the extended bull market in equities. The preferable scenario for the gold market was the breakout of this chart to confirm the bull market and start the final SandP rally to above $4000 for the final top (into March/April?) before the deflationary crash which would take everything down and launch the bear market rally for the dollar. The gold was supposed, in such a scenario, to rally up with the SandP and then come crashing down before the decoupling happens and the inflationary cycle starts. 
Well, this is clearly not happening. The TRAN is about to generate the unwanted double sell while, at the same time, the most critical resistance level rejects further advance and leads to the possible breakdown of the uptrend. This development clearly is adding to the dangerous nature of the current SandP setup. If it transpires it would probably be wise to take a dollar long position. 


TLT - long bonds ETF
TLT chart looks horrible. It is as bearish as it gets. It recently sold the long term 218-222 echo, it is far below the long term uptrend line and the path of least resistance is down. This doesn't mean that the FED is not going to jump in and start pushing it up which is another good example of how the charts might be irrelevant here but...What if they decide to just let it fall, a sudden sharp rise in interest rates will prick the SandP bubble and take everything down and launch the dollar rally. That would be a good and necessary overture for the 'big reset' and would probably eliminate any political opposition that the new administration would have in implementing new policies, especially when we know that some of them will be along the line of the 'new deal' equivalent (great reset, new green deal) and therefore opposed by many. When one thinks about it, it is probably more opportune for them to let the market deflate now and then introduce the new measures in the aftermath and build on them until the next election cycle than to try to save this market now and then have an uncontrollable political situation in the future when they need it the least. If they do it now they can easily blame it on covid and Trump and then take credit for 'saving' the economy by opening spigots of monetary and fiscal easing. This is just my stupid speculation but who knows?
Anyhow, this thing screams danger!


UUP
Like all the other charts the UUP is at an important juncture. A small move up or down and it will trigger a buyable 35-39 buy signal or the continuation of the downtrend. The potential 35-39 buy is perfectly aligned with the resistance line and, as I explained before, that is what makes good tradable signals. The potential 16-20 buy is not a potent signal for the further decline since it is actually buyable short term support. 
This is again one more chart that adds to the vulnerability of the S and P chart. 


Bitcoin
Finally deflating. The 16-20 buy signal provided an instant rally but there is a potential double sell looming at the $36000 level in two weeks time. 


Inflation expectations
The inflations expectations are continuing the rally but the recent action looks toppy (double top?). If it goes into a correction that will contribute to the dangerous side of the S and P setup. 


As you probably could already conclude yourself I am of the opinion that this market is at a very critical juncture, the gold market included. We are still in the position to arrive at my desired destination via continued climbing the wall of worry but if we get there it will certainly be along an impossible route. Markets tend to do that and it wouldn't be the first time that everyone got fooled until the final hand was shown. The technicals are against us but the fat lady hasn't sung yet. There is a case to make that charts don't even matter at this point. 
The current state of the charts, if they matter, is also a good illustration of how SKI setups in different markets work in unison and provide value to interpreting signals.

I am holding my core position (gold and silver bullion mostly). I am pretty sure that we are entering a volatile period with the possibility of an ugly market crash. The other possibility is a reignited rally that might or might not come after a scary short term correction (maybe to buy the 16-20 echo in SandP). I am not able to call it either way but the high probability of some strong moves is certainly written in the charts.


Best luck to everyone,

Branko


Wednesday, 20 January 2021

Wall of Worry III

My theses for the last three weeks have been that there is a possible wall of worry unfolding in the gold market that eventually should lead to the birth of a new bull trend.  During the week this theses has been tested to the extreme. Prices have fallen to test the support and eventually started generating double buys across the sector as a potential confirmation that the bottom is in. For the bullish outcome of the current action, these double buys should hold and then follow through to new 92-96 buys. 

Let's see the charts.


USERX
Since the last time, the USERX price fell further down to touch the lower boundary of the uptrend channel. The channel was breached for a day while at the same time a 16-20 buy signal was generated to enforce the support. The price bounced back immediately and is back inside the channel now. In my books, this is a very bullish behaviour because the action is happening above the support level. All xxing is off now and the next 92-96 signal, if it happens, will be a confirmation of the new bull trend. The stop loss is still new 35-39 sell signal (bellow trendline). 
It is important to point out that we are not out of the woods yet and that there is a bearish setup in the second week of February if we do not lift off from here. 


HUI
The double buy scenario that I described three weeks ago is now close to confirmation. The HUI price moved down to test extremely important $286 level and it seems that the support held (lowest close was 284.53). The direction of least resistance is now up (assuming that the 35-39 is going to buy). The 35-39 buy will be on the path of trades and not xxed out. That should push the price toward the 92-96 index quickly.  


XAU
XAU never sold the 35-39 index but it did sell the 92-96. All xxing is off now and if price makes it to $155ish in the next two weeks new bull will be on. It is important to generate a new 16-20 sell soon.


GDX
The GDX price held easily above the support line and generated the double buy signal. The 35-39 is not xxed out and this signal should push the price towards the resistance and help the new 92-96 buy in February. 


GDXJ
The GDXJ price, similar to the HUI, is testing the 2016 top breakout from the above. The double buy has been generated and the whole correction pattern looks like a double bottom. The 35-39 is not xxed which makes the signal more potent. The breakout through the downtrend should coincide with the next 92-96 buy. 


GLD
The GLD price is squeezed at the apex of the contracting triangle and is about to generate the double buy except if the price tomorrow crashes 3.36%. The 35-39 buy is not xxed therefore more potent. The path of least resistance is up. The new 92-96 buy is possible in the first week of February. 
There is still bearish setup in Feb if the price fails to lift off. It is worth keeping an eye on this possibility. 


SLV
The SLV price is above the resistance and is set to generate a true bull buy signal. Depending on the trajectory the signal could be single or double buy. A new 35-39 before the 92-96 signal would trigger the stop loss. 


S and P 500 
S and P is in an uptrend and the price is moving along the uptrend line originated at the 2019 low. It is overbought on all timeframes and probably prone to short term correction. The projected target, based on the break of the cup and handle pattern discussed in my previous blogs, is $4000+. 
I have discussed before the possibility of a melt-up run to the top if the UUP breaks down through $24.41, gold generates the bull signal and the transport index confirms the bull market by breaking through into the blue sky territory.  The dollar has closed bellow 24.41, transport index looks like a breakout and the only thing missing now is the gold bull.


TRAN - transport index
The transport index price is holding above the breakout level and if it can keep it up for another week the danger of the possible double sell will diminish. Such a development would be positive for the S and P 500 further advance. 


UUP
The dollar price is in the downtrend. I said last week that I expected some short term dollar strength, at least until the 16-20 index is touched or sold. The sell has happened now and so far it has marked the top. The price is still under the pressure of the declining resistance line so I do not expect a breakout for the dollar without some more struggle. 
If the gold is breaking out and the S and P is about to start the melt-up run this chart should not break out. 


TLT - long bonds ETF
Bonds price has sold the long term 218-222 index and is now in a completely bearish configuration. So far this sell has marked the low but this chart looks very bad long term. I am not sure how to reconcile this chart with the gold chart though. Normally, it should be negative because it would imply interest rate hikes but in the current environment that is not the probable outcome. Maybe it is just the indication of the upcoming inflation because in such a configuration it is logical to expect deteriorating TIPS/TLT ratio. 


Bitcoin
Finally, the bitcoin price started a consolidation or maybe even a correction. Since 100 days (full cycle) have passed since the last 35-39 index buy I would think that correction to touch sell the 35-39 could be in the cards. I would be interested to establish a small position under $24000.


XGD - Australian gold index
The XGD price held the support and is on the way to generating a double buy. If the buy results in a rally the price needs to go over $8500 before the new bull trend is confirmed. 
The important detail is that the support held at 218-222 long term index, the same index that marked the March low.


Inflation expectations
Inflation expectations price is in a firm bullish uptrend.


So, the Biden economy era begins. The day of the inauguration has been marked with multiple double buys across the gold sector to hopefully mark the end of the correction. I do not think this coincidence is by chance. Also, I need to remind you that the most valid SKI signals are usually happening simultaneously and, because that is the case here, I have a lot of trust in this current development. Over the next two weeks, we should see these double buys morph into new 92-96 buys to mark the beginning of a new bull period and the end of the wall of worry stage.  
I am 100% long gold sector. The stop loss is a new USERX 35-39 sell signal.


Good luck everyone,


Branko


.


Sunday, 10 January 2021

Wall Of Worry II

This last week a lot has happened and nothing has happened. 
The Friday nasty drop in gold was the third biggest one day drop in the last 12 months. The biggest being the one when the covid vaccine was announced in August and the second one was the one when the covid news came out of China in February 2020. What is the reason this time? I suppose Trump's defeat but I cannot be so sure why would Biden's reign be so bad for gold? I do not have the answer.
The 'nothing has happened' part of the last week's action in gold price is that nothing has been broken yet. Everything that I spoke about the last week still stands, the gold price is still inside the rising channel and above the support, the same as the HUI, XAU, GDX, GDXJ and other indices.
The sentiment is gloomy and depression among the gold bugs is widespread. It seems that every news is bad news for gold and we just need the final shot in the head for everyone to give up. On the other hand, isn't that how the wall of worry should feel and look like?
Let's check the charts.

USERX
The USERX price is trending up inside the channel. The double buy signal that has been generated last week marked a top so far and caused this nasty drop. Coupled with the bearish triple 1down2up it seriously looks like trouble brewing. All important tops in the last 20 years were marked with this run pattern and to worsen the problem if the price keeps falling for another two days it could generate the death run top run pattern. There is also a possibility for an ultimate bearish triple sell in February but let's not go too far ahead for now. 
So what is good news? The good news is that the coming 92-96 sell will take the xxing off and set up the stage for a true bull signal if the price manages to stay above 13.30ish till Feb 1st. If during this period it also manages to buy the 16-20 before the 92-96 it will generate a super bullish double buy.
As you can see the stage is set up for a big move. There are two setups one which is a very bullish one and the other one which is a very bearish one. The time is running out and the market will tip its hand by the end of January. 
My stop loss is a new 35-39 sell signal. 


HUI
The price of HUI generated the 35-39 buy and so far this is the top of this move up. The Friday's crash moved the price back below the 35-39 index and it seems like the double buy scenario from the last week is setting up. If the price drops down to 285ish and then turns around a double buy will be generated right at the support. 
If the 16-20 buy cannot stop the drop the first target is 250 and then 230, that is 20-25% drop from the current level.
In my HUI weekly chart analysis, two weeks ago, I presented why $285 is very important and firm support. If this support gives up I believe that drop to $230 is possible but I still do not think that it is the more probable scenario. 


XAU
Similar to USERX this chart has generated xxed double buy to mark the top and now is in the process of selling the 92-96 which is going to set the stage for a true bull signal. Nothing has been broken so far and an event that would signal such a thing would be a 35-39 sell. 


GDX
Similar to HUI, double buy is setting up. The level that must hold is $33ish. 


GDXJ
GDXJ is the only gold index that didn't buy 92-96 so its configuration is a little bit different. There is the potential for a double buy but it seems that more probable is a drop-down to test the previous low at $48.


GLD
GLD price bought the 35-39 index but it fell short of buying the 92-96. No technical damage has been done yet. After the Friday's drop the price, which looked like breaking out of the contracting triangle is back inside the triangle and the double buy 16-20 and 35-39 is possible if the current level could be defended. If the gold price falls out of the rising channel probable target is $158 (61% fibo retracement of the recent rally). 


SLV
Silver jumped out of the contracting triangle just enough to buy the 92-96 index and then dropped back inside the triangle on Friday which will cause the 92-96 index to sell and turn xxing off. This sets the stage for a new bull signal if the price can stay above 23.50 by the beginning of February.  The stop loss for this chart is a new 35-39 sell signal. 


S and P 500
S and P moved further up and I'll just repeat the last week's comment.
S and P is in an uptrend and the price is moving along the uptrend line originated at the 2019 low. It is overbought on all timeframes and probably prone to short term correction. The projected target, based on the break of the cup and handle pattern discussed in my previous blogs, is $4000+. 
I have discussed before the possibility of a melt-up run to the top if the UUP breaks down through $24.41, gold generates the bull signal and the transport index confirms the bull market by breaking through into the blue sky territory.  The dollar has closed bellow 24.41 but I am waiting for the gold and the transport index to confirm.


TRAN - transport index
The TRAN chart is the most interesting chart at the moment because I think it is going to be the tell, melt up top or the end of the bull now.
Transport index has had a strong week and is back above the level needed to confirm the new bull market. At the same time, the TRAN generated the new 16-20 sell index for resistance. As described in my last week's analysis this is setting up the stage for a nasty double sell right at the critical level. The price must now rise further up otherwise the sell will execute. 


UUP
The dollar is in the downtrend but it has shown some strength last week.
 I do expect some more strength from the dollar at least to touch/sell the 16-20 index before it resumes the downtrend. However, I have checked the long term weekly chart and the case could be made that the long term dollar chart is in the process of finishing the right shoulder of the mega bullish inverse head and shoulder pattern. If that is true then the possible breakdown of the gold chart should not be treated lightly, on the contrary, it is very very dangerous. 


TLT - long bonds ETF
I was very wrong the last week thinking that the bonds have bottomed. That thinking was on the premise that the 35-39 index will buy but it didn't. Instead, the crash happened and now the price is threatening to sell the very long term 218-222 index. This crash could be one of the reasons for the gold's hard sell-off.  
If the 218-222 sell happens it might mark a temporary low but the long term consequences of such a sell would be very negative for the bond market. 


Bitcoin
The mania continues


XGD - Australian gold stocks
Recently Australian gold stocks never disappoint to disappoint. They always follow the USA market down and never follow them up. If the XGD price breaks the support the next stop is 6900 and then 6500, which if it happens will cancel all gains from the March breakout. 
The chart looks worrying but not broken yet. 


Inflation expectations
Still in an uptrend but look short term overbought.


I think that the charts are telling us that the big shift is happening in the financial and equity markets. I think we are switching from the 'covid trade' to the 'Biden economy trade' and the starting positions are being taken. How are the gold bullion and the gold shares going to perform I am still not sure. The charts sure look like the wall of worry is still underway but the picture can change at any moment. 
I am still 100% long, my stop loss is a new 35-39 sell signal. If the gold fails to establish a new bull trend by the end of January it will be time to regroup based on the new configuration. 


Good luck to all,


Branko