email: branko.askovic.ale@gmail.com
X: BMGold @Brankoasko93725
USERX


email: branko.askovic.ale@gmail.com
X: BMGold @Brankoasko93725
email: branko.askovic.ale@gmail.com
X: BMGold @Brankoasko93725


email: branko.askovic.ale@gmail.com
X: BMGold @Brankoasko93725


email: branko.askovic.ale@gmail.com
X: BMGold @Brankoasko93725


email: branko.askovic.ale@gmail.com
X: BMGold @Brankoasko93725


NEM is flashing buy signals on all time frames, regardless of the technical analysis tool I'm using.
Daily
On a daily chart, a test of the 50-day MAV is in progress and likely finished successfully two days ago with the price breaking out of the downtrend from the May top. The MACD has just given a buy signal, the RSI is above 50, the price is above the 200-day MAV, and the ADX indicates plenty of space for a sustainable rally. Only the EW structure seems incomplete, so another test of the 50-day MAV is not out of the possibility. However, come the reporting season, NEM should be on its way to over $50 and beyond.

Weekly
Zooming out from the daily chart gives us a picture of a retracement in progress from the 2022-2024 leg down. For the price to target the $51.2 retracement level, $42 must be overcome, which would confirm the bottom is in place. This represents a 20% rise from here, likely requiring 2-3 months to transpire. All indicators are in place for such a move. After some consolidation, the next target would be $57.92 to confirm a long-term bottom and set the stage for targeting $88 and above, probably by Q1 2025.

The monthly chart shows a MACD buy signal generated last month. The 38.2% Fibonacci retracement to $51.2 will put the price back above the bull trendline that started at the bottom of 2015. Again, all indicators are positive for such an outcome and have plenty of space to run. Seems like a matter of time.
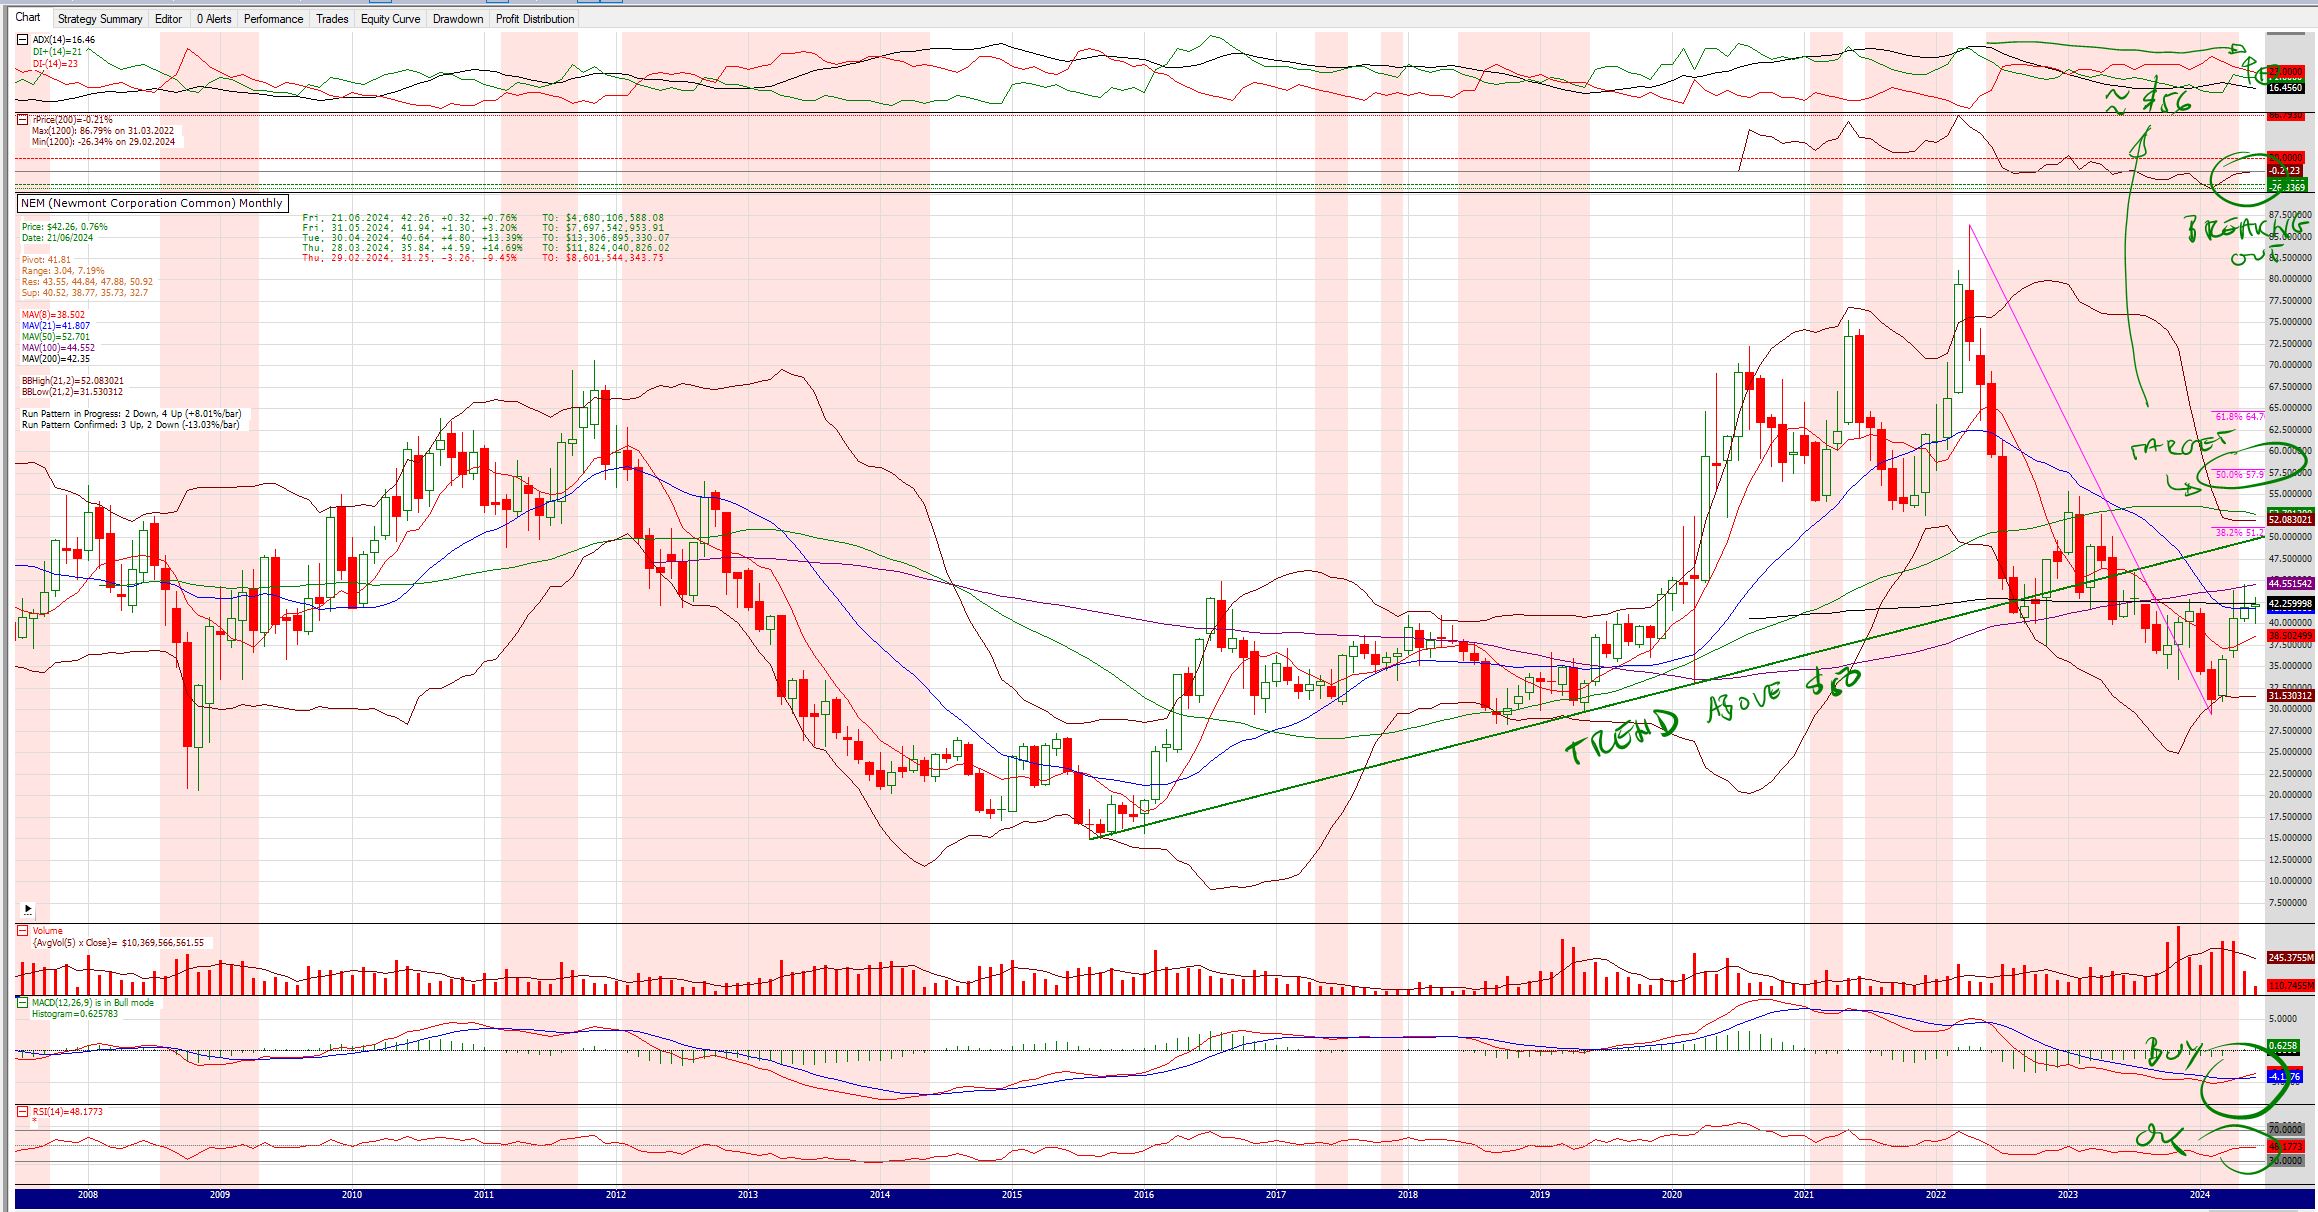
SKI indices
As I reported in May, NEM's 92-96 index generated a true bull buy signal, which is still alive and well. Normally, such signals are followed by a retracement before the bull market takes hold. In this case, the retracement was of a normal size, and after the downtrend line was broken a few days ago, it seems that either the 35-39 will sell/buy to start a new leg up or it will simply hold. Once $42 is broken, the price is expected to explode to the upside.

SKI long term indices
The 218-222 long-term index executed a buy today, and the 439-443 index is breaking to buy, forming a very long-term double buy. The 439-443 back prices are currently in the $41.25-$42.8 range, again confirming that $42 is the resistance to overcome before things accelerate. The position of the 660-664 and 881-885 indexes shows that the next resistance is in the $56-$64 area, confirming the readings from the weekly and monthly charts.

I have accumulated a sizable NEM position over the last month and a half and will add more on any significant weakness.
email: branko.askovic.ale@gmail.com
X: BMGold @Brankoasko93725


email: branko.askovic.ale@gmail.com
X: BMGold @Brankoasko93725


It is a common complaint that Aussie gold stocks are not performing well compared to the AUD price of gold. While this is mostly true when considering the last 12 months, it looks different when observing chart waves, which better represent relative performance.
I have chosen to observe the movement from the bottom of October 2023 to the top of May 2024.
XAUAUD went from a bottom of $2442 to a top of $3794, a move of +55%.
In the same period, XGD went from a bottom of $4221 to a top of $8100, a move of +91%.
While gold made a new all-time high structurally, the stocks did not, which is a problem. However, the move from the bottom was roughly 2:1, as expected in a bull market.
In the XGD chart, it is visible that stocks are on the verge of breaking out of a 4-year-long inverse head and shoulder pattern, which, once broken, will propel the price straight to the $11449 level. Only then will a bull market in gold stocks really commence.

If we switch to the XGD monthly chart and consider the move from the 2016 low of $1642 up to the 2020 high of $9888 as wave 1 of the bull market, then projected Fibonacci extensions for the ongoing wave three (assuming wave two is in place) are: $11834, $13037, $14011, $18134, and $23230.

Once the XGD $7700 level is left behind, I expect the bull market to accelerate quickly. We might have to wait a few weeks or even a couple of months, but once the move begins, it should be explosive.
email: branko.askovic.ale@gmail.com
X: BMGold @Brankoasko93725


email: branko.askovic.ale@gmail.com
X: BMGold @Brankoasko93725


email: branko.askovic.ale@gmail.com
X: BMGold @Brankoasko93725


email: branko.askovic.ale@gmail.com
X: BMGold @Brankoasko93725
on 92-96 BUY, OnPath, XXed, 150 days, +24.94%; (also, 16-20 on SELL; 35-39 on BUY; 92-96 on BUY; 218-222 on BUY; current $5431)
*Comment/Dec29: The S&P is currently exhibiting a bullish configuration. The recent 92-96 buy signal marked the beginning of a rally that brought the price close to the old all-time high at $4818. While short-term overbought conditions could potentially lead to a correction, the long-term structure now appears to be bullish. However, at this moment, I'm not inclined to actively pursue the upward trend. Instead, I'm considering reevaluating my position after a potential correction has occurred.
NEW/Jan19: Unfortunately, the correction didn't go deep enough to get me interested in establishing a long position. The price action remained sideways until it touched the 16-20 index back prices, followed by an explosive upward movement, which is characteristic of bull markets. Today, the price closed at a new all-time high. The Commitment of Traders (COT) readings are neutral, and the long-term SKI indices are on buy signals. Thus, everything on this chart points to a continuation of bullishness.
NEW/Mar13: The rally appears to be getting long in the tooth. I'm waiting for a break of support to consider entering a short position once more.
NEW/Apr08: The price has broken down from a bearish rising wedge pattern, accompanied by a bearish mode in the MACD indicator. Speculators are buying into this fall, while commercials are selling, indicating a bearish sentiment. Additionally, there are divergences present across various indicator plots. However, the net positions of both commercials and speculators in the COT report are not as extreme as they have been at significant recent highs. I anticipate a consolidation or correction phase is currently underway, possibly targeting the 50-day moving average at $5089 or even filling the gap at $4983 in a more serious scenario.
New/Apr12: The bearish development continues with the recent decisive break. I'm actively seeking a short entry opportunity.
New/Apr26: The gap mentioned in the March 13th post has indeed been closed. The 50-day moving average support has been broken, and the 35-39 index sold and holding. I will initiate a short position on a 16-20 sell signal or in case of an obvious news failure before that, perhaps on FOMC day. However, if the 35-39 index buys back, my plan will be cancelled.
NEW/May07: The 35-39 index has generated a buy signal. The same setup is developing as in September 2023. After a new high, the price rolled over to sell the 35-39 index (and 50-day moving average), then rose to buy back the 35-39 (and 50-day moving average) for a lower high, followed by a 16-20 sell signal. Subsequently, the price continued downward for another 35-39 sell signal which constituted a double sell with the 16-20 sell. That was a shorting point, and if it happens again, I'm going short. COT positioning supports this setup, so we will see. If the price continues upward, we will soon be in new all-time high territory, and the bull market will continue.
New/May17: The short setup still exists, but with the price at a new all-time high, the structure differs from September 2023. We'll see how this develops, but even if we get a sell signal now, I'll be hesitant to execute. I will likely wait for a proper 92-96 sell signal before considering such action.
NEW/May23: Based on the significant reversal day last night in New York, I've decided to short SPY as a hedge for my gold position. So, I'm now fully short on the S&P 500 with a very tight stop at $5350. I want to stress that this is a hedge; otherwise, I wouldn't short before receiving proper confirmation from a 35-39 sell signal.
NEW/Jun07: The 35-39 index sell signal has been avoided, and the price is at an all-time high again. All indexes are aligned in a bullish manner once more. I have removed my short position that was intended as a hedge for my long position in gold stocks.

HUI - NYSE ARCA Gold Buggs Index
on 92-96 BUY (with 35-39 for a double buy), OnPath, NotXXed(true), 67 days, +14.12% (also, 16-20 on BUY; 35-39 on BUY > breaking to SELL; 92-96 on BUY; 218-222 on BUY; current $262.06)
*comment/Mar11: Simultaneous 92-96 and 35-39 buy signals were generated today for a double buy, with 92-96 on the path and not xxed therefore indicating a true bull market. However, I'm cautious and see these signals as part of forming a bottom. The breakout into a bull market isn't confirmed until at least $250 is broken, but more probably $270. Nonetheless, upward pressure persists, with the next target at $250. A healthy consolidation around $230-235 is desirable.
NEW/Mar25: Consolidation is indeed underway. The 92-96 index back prices will dip to around $210 over the next seven days. In this period the price is allowed to drop as low as $220 and the buy signal will remain intact, but it will then need to rise above $245 by April 10th to avoid rising back prices.
NEW/Apr03: The $250 target has been reached, with the 218-222 index breaking towards a buy signal. Momentum remains strong, suggesting that the $270 target will likely be achieved soon. Interestingly, despite gold reaching an all-time high, the HUI and other gold miner indices are still relatively subdued, with HUI at $260, below its 2020 high of $373 and far from its 2011 peak of $638. Resistance at around $300 from the 2020 high implies a significant hurdle to overcome before a substantial acceleration can be expected. Until then, navigating levels below $300 may feel like overcoming a wall of worry.
NEW/Apr08: The $270 target has been hit. A healthy consolidation between $250 and $270 in the coming weeks would be beneficial, but it is not guaranteed. Support currently lies around $245.
NEW/Apr26: So far, the consolidation is proceeding as anticipated. The lowest price reached was $248.67, just slightly above my projected support level. Currently, we are back at the top of the range at $270. It's likely that more time is required for this consolidation to conclude, but ultimately, we should see an upward trajectory with the next target around $300. Support is currently around $250-255.
NEW/May03: The 16-20 index generated a buy signal, marking an important point in time. This signals that either a new leg up is about to start or the correction is poised to accelerate.
NEW/May10: The 16-20 buy signal sold after 5 days for a 4.88% profit, as expected in a bull market. Additionally, the price closed at a new high for this wave, which is bullish. However, the double 1d 2u run pattern and the strong resistance level are concerning. It's crucial that $270 holds in the next few days. If it can't, $255 is the next significant support. If that breaks, a plunge to around $230 could follow.
NEW/May17: The price is finally approaching the $300 target. This move appears to be the 5th wave approaching major resistance. The $300-320 area is a good place to reduce the position and wait for a correction.
NEW/May29: The short-term trend is still holding, but just barely. The 2016 top price has been reached, and it certainly feels like a top is forming here. Reducing positions seems like the right move.
NEW/Jun07:The correction continues, and the price is approaching the first Fibonacci retracement level at $256.14. It seems likely that the 35-39 index will sell before some kind of a low is formed.

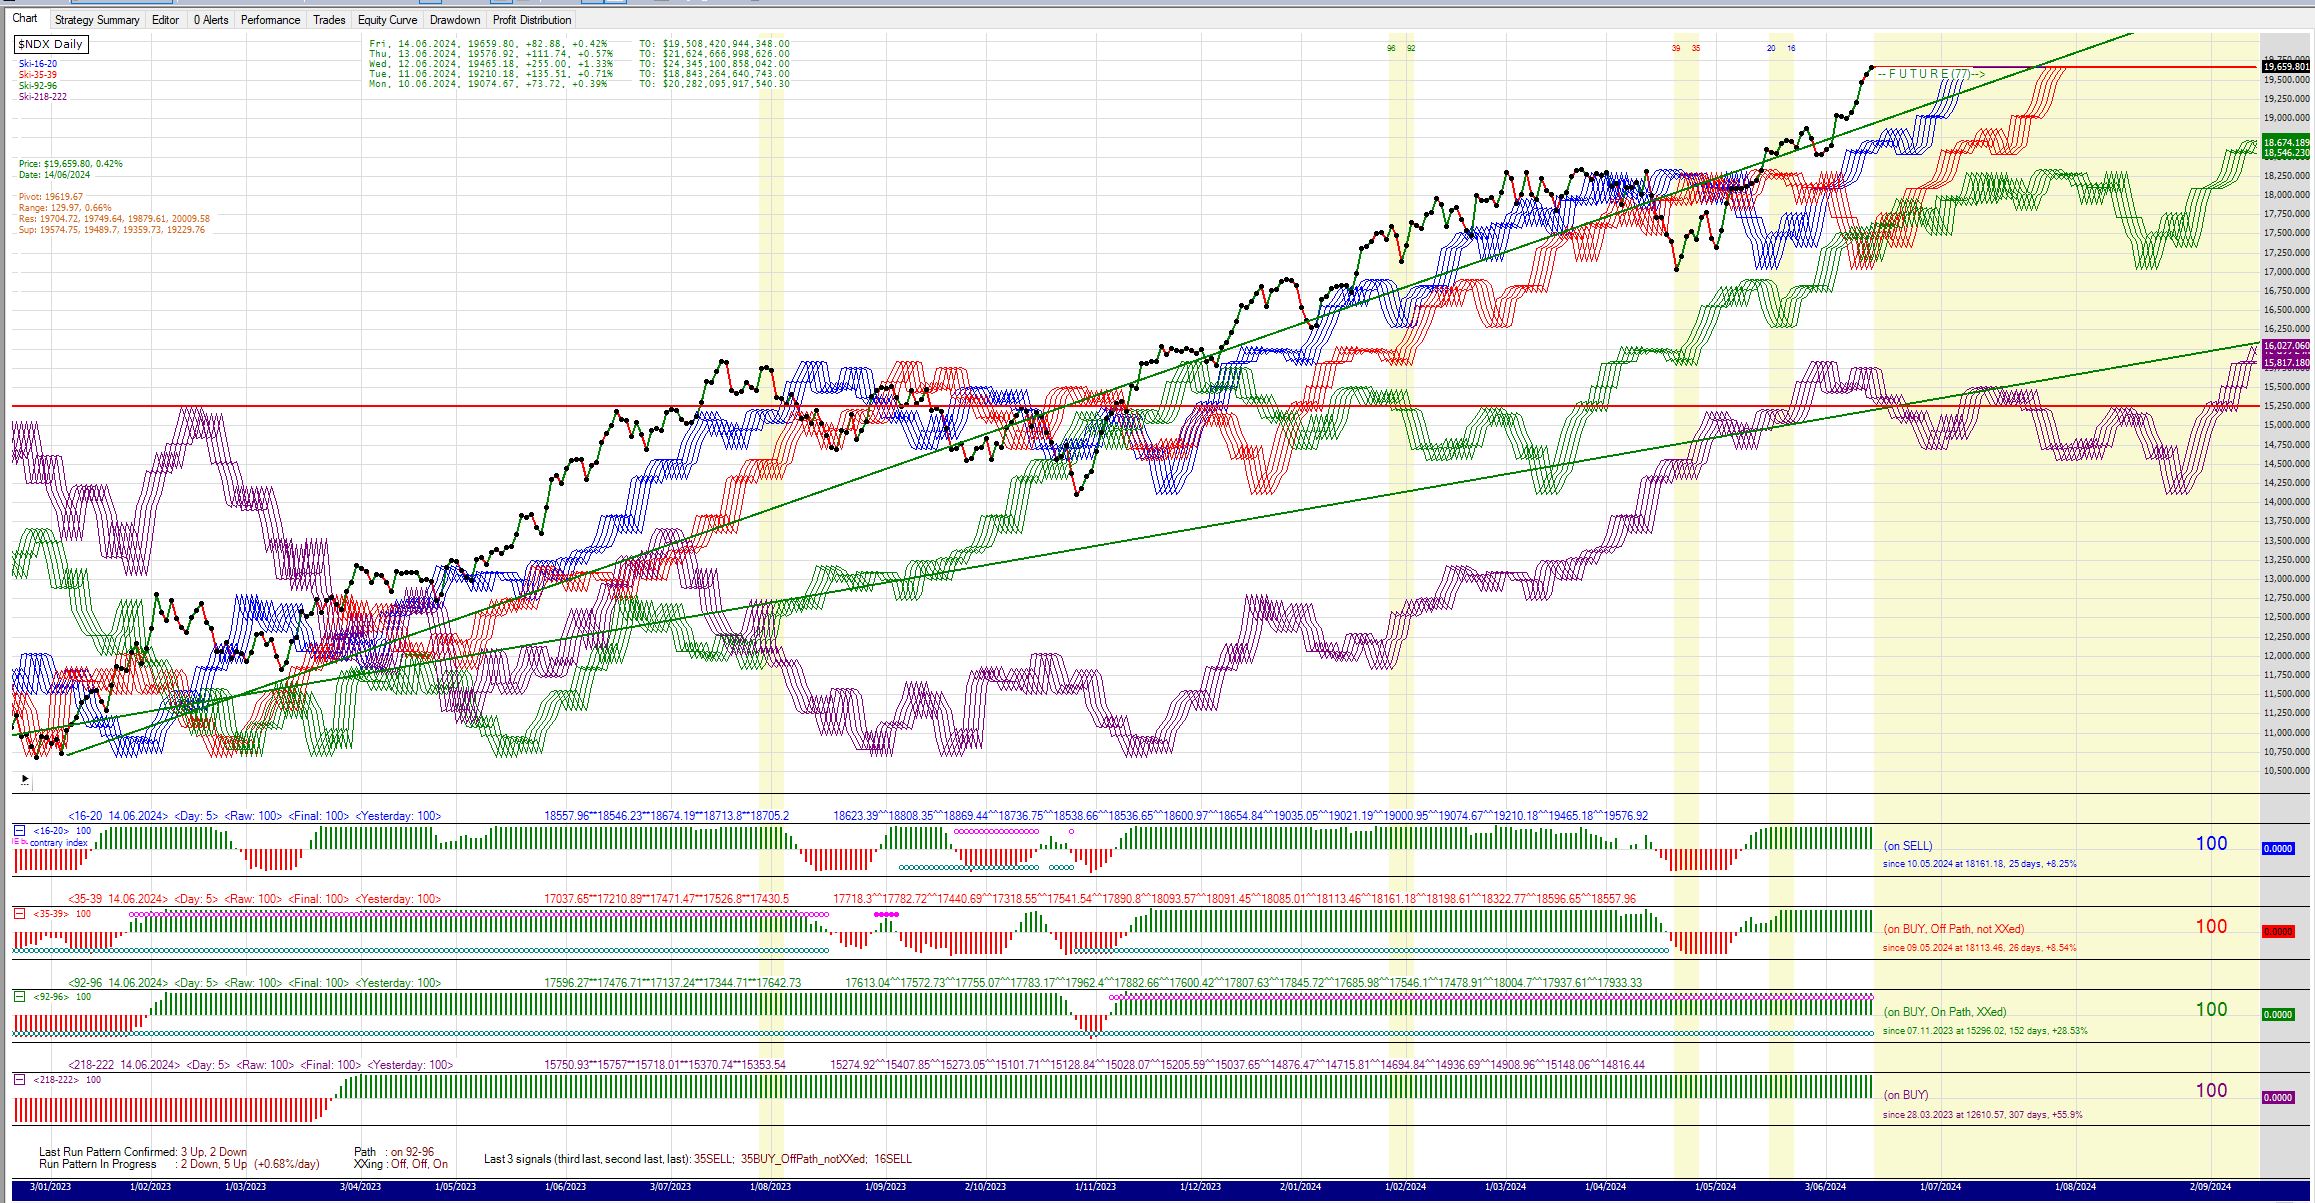
$NDX - Nasdaq
on 92-96 BUY, OnPath, XXed, 152 days, +28.53% (also, 16-20 on SELL; 35-39 on BUY; 92-96 on BUY; 218-222 on BUY; current $19659)
*comment/Dec29: The chart is currently displaying a bullish configuration. The recent 92-96 buy signal aligning with the breakthrough of the resistance line enhances its potential impact. An all-time high has been achieved, but in the short term, the price appears to be significantly overextended and possibly in overbought territory.
NEW/Jan19: The bull run persists. The manner in which the price engaged with the 16-20 index back prices suggests more of the same in the future.
NEW/Jan26: SKI-wise, there haven't been any changes compared to my previous comment. In the short term, there is a lag in the performance of NDX compared to SPX, which might indicate the development of a short-term top. However, the fact that speculators have reduced their COT position is not consistent with the formation of a top. The pattern to watch for would be the speculators buying into the rally while NDX lags behind SPX. I am on the sidelines, waiting.
NEW/Mar13: The rally appears to be getting long in the tooth. I'm waiting for a break of support to consider entering a short position once more.
NEW/May08: The setup is similar to the S&P 500 chart. If the price doesn't surge to a new all-time high level soon, there's a possibility of a double sell signal occurring.
NEW/May17: The short setup still exists, but with the price at a new all-time high, the structure differs from September 2023. We'll see how this develops, but even if we get a sell signal now, I'll be hesitant to execute. I will likely wait for a proper 92-96 sell signal before considering such action.
NEW/May29: The price has reached a new all-time high, making the likelihood of a double sell signal diminish by the day.
NEW/Jun07: The 35-39 index sell signal has been avoided, and the price is at an all-time high again. Everything is aligned in a bullish manner once more. The bull market continues.
on 16-20 BUY, OnPath, XXed, 8 days, -2.8% (also, 16-20 on BUY; 35-39 on BUY; 92-96 on BUY; 218-222 on BUY; current $2024)
*comment/Feb16: The chart is currently displaying a bullish configuration. The 35-39 buy signal from November 2023 has sold and instantly bought back, while the 92-96 index is on a buy signal. This signal is occurring just below the upper boundary of the upward-sloping trending channel dating back to the 2022 low. However, this 35-39 signal could either mark a top or signify the beginning of acceleration. Based on the current structure, I am leaning toward a scenario where it marks a top, potentially leading to a correction, with a minimum target around $1850. If this prediction holds true, the correction may end with the price testing the support of the 92-96 index, at which point the future direction of this market will become clearer.
NEW/Feb27: The 35-39 buy signal generated on February 14th did indeed mark a top, followed by a minor correction. This correction subsequently reversed back to a 35-39 buy signal. The prevailing pressure seems to be on the upside. However, to confirm the start of a new upward trend, the $2070 level needs to be surpassed. If this level is successfully breached, the initial target will be $2150, with the ultimate target set at $2350.
NEW/Mar13: The $2070 resistance level has persisted for the past three weeks, while support is also holding near this level. A resolution seems imminent, with either a breakout above $2070 leading to a rally or a downturn below $2060 signalling a correction towards $1900ish.
NEW/Apr12: The support has been breached, signalling further downside movement. The initial target on the downside is around $1880. I will go short on a 35-39 sell signal.
NEW/Apr26: The 35-39 index did sell, and the downside target was reached. I closed my initial short position and intend to short again, likely on a 16-20 sell signal. However, if the 35-39 index buys back, I will cancel my plan.
NEW/May09: Some bearish signals are setting up. A prompt surge to new highs is necessary to avoid a potential double sell.
NEW/May17: The 35-39 buy signal came one day after the 16-20 sell signal, so the double sell setup does not exist here. A better opportunity to short the Russell will arise if the 92-96 and 35-39 sell signals coincide in the second half of June, but for that to happen, the price needs to fall below $2000 first.
NEW/May29: The 35-39 index has finally sold, but since it's not a double sell, I won't establish a short position. There is a confluence of back prices of all indexes around June 10th at the $1980 level. I believe this area will act as a price magnet over the next two weeks. It will be interesting to observe the price behaviour once we reach that level.
NEW/Jun07: The price action over the last few days certainly confirms my expectation that $1980 is acting as a magnet. We're not far from reaching that level now.
NEW/Jun14: After the 16-20 buy signal, a 35-39 buy signal was triggered, forming a double buy. However, this event has only marked a high so far. The Russell is diverging from the S&P and Nasdaq in a bearish manner, confirming my expectation that $1980 acts as a magnet. If I'm right, the 92-96 index might sell with potential bearish consequences, targeting $1890-1900. On the other hand, if 92-96 acts as a support the price will rise back to $2100 resistance before the end of July.

$TNX - 10Y yield
last signal 35-39 SELL, 8 days, -1.77% (also, 16-20 on BUY > breaking to SELL; 35-39 on SELL; 92-96 on BUY; 218-222 on BUY; current 4.21)
*comment/May29: The SKI chart currently shows a bullish configuration. After the 92-96 index generated a buy signal, it seems the drop to test the uptrend at 4.3% has concluded, and the 10-year yield (10yy) is now rallying towards the target of around 4.9%-5.0%. If this assumption is correct, it is difficult to envision the rally in equities continuing.
NEW/Jun07: After my last post, contrary to my expectation the 10-year yield (10yy) plunged to a new low, finally hitting my initial target at 4.3% (4.277% to be precise). Friday's surge seems to have put the bottom in place. The next target is a 35-39 buy signal around 4.6% and above.
NEW/Jun14: In hindsight, both my assumptions that the bottom was in place were wrong. It seems that the 35-39 sell signal marked a breakdown of the 4.3% support level, and we are now heading lower to test the 92-96 index support at the 4.0%-4.1% level.

XAU - PHLX Gold and Silver Sector
on 92-96 BUY (double buy with 35-39), OnPath, NotXXed(true), 67 days, +14.34% (also, 16-20 on BUY; 35-39 on BUY > breaking to SELL; 92-96 on BUY; 218-222 on BUY; current $135.01)
*comment/Mar19: Both the 35-39 and 92-96 indexes have issued buy signals, forming a double buy scenario. The 92-96 signal, is on the path and not XXed, therefore marking the potential for a true bull market. However, typical of such signals, a correction has ensued. It's critical for this correction not to deepen beyond $110; otherwise, both buy signals will conclude, returning us to the downtrend channel and possibly deferring the bull market until the latter half of the year. To confirm the bull market a price rise over $130 is necessary.
NEW/Apr08: The necessary condition to confirm the bull market has been met, with the breaking of the $130 resistance level. Support is currently around $125. While some healthy consolidation would be welcomed, the overall outlook remains bullish.
NEW/May03: The 16-20 index generated a buy signal, marking an important point in time. This signals that either a new leg up is about to start or the correction is poised to accelerate.
NEW/May10: The 16-20 buy signal sold after 5 days for a 5.7% profit, as expected in a bull market. Additionally, the price closed at a new high for this wave, which is bullish. However, the double 1d 2u run pattern and the strong resistance level are concerning.
NEW/May17: Looking at the weekly chart of XAU, it's noticeable that $160 is a major resistance stemming from the 2020 top. The price is now approaching this target, and it appears to be the 5th wave of the rally. For this reason, the $160-170 area seems to be a good place to reduce the position and wait for a correction.
NEW/May29: The price action in XAU appears somewhat toppy. Since the $160-170 target area was nearly reached, it seems reasonable to begin reducing positions to navigate through an upcoming correction.
NEW/Jun07: The correction continues, and the price is approaching the first Fibonacci retracement level at $133.14. It seems likely that the 35-39 index will sell before some kind of a low is formed.

ASA - Gold and Precious Metals Ltd
on 92-96 BUY, OnPath, XXed, 98 days, +17.77% (also, 16-20 on BUY; 35-39 on BUY > to SELL 16.54/-4.39% or lower; 92-96 on BUY; 218-222 on BUY; current $17.3)
*comment/Mar25: ASA is in a bullish setup with both the 35-39 and 92-96 indexes on buy signal. Confirmation of a bull market requires a close above $15.5 by early April or the 92-96 signal will end. Falling below $14.2 could delay the bull market until later in the year.
NEW/Apr08: The condition to confirm the bull market was satisfied. Breaking through the key resistance at $15.5 triggered an explosive surge, leading to buy signals on the 218-222 and 439-443 long-term indices, indicating long-term bullishness. While some consolidation is expected, the next target is in the vicinity of $19.5 and should be reached within the next two months.
NEW/May03: Unlike other gold indices, ASA hasn't initiated a correction yet. This is bullish, especially given ASA's strong track record in predicting gold sector behaviour in recent years. However, the confirmation of a 1 down 2 up chart pattern across the sector might signal that ASA is poised to join the rest of the indices in undergoing a correction.
NEW/May10: Resistance at $17.5is seems broken if today the price can hold above $18. The next target is $19.5.
NEW/May29: The price hit the $19.5 target exactly and has been in retracement mode since then. It seems wise to take profits now and wait for the correction to run its course.
NEW/Jun07: The correction continues, and the 16-20 index bought today. Additionally, the price is approaching the first Fibonacci retracement level at $17.08. Unlike other gold indices, it is not so sure that the 35-39 index will sell but if it does it will be around $16.34 the 50% Fibo retracement which would be a good place for a low.
NEW/Jun14: The $17.08 retracement level was hit intraday Thursday. The 35-39 index is breaking toward a sell signal, which, in combination with other factors, might be a good place to open a long position and try to catch a temporary bottom (for short-term traders).

BITCOIN
92-96 SELL executed today (also, 16-20 on BUY > breaking to SELL, 35-39 on BUY, 92-96 on SELL > breaking to BUY, 218-222 on BUY, current $66228)
*comment/May29: BTC is in a bull market configuration, with both the 35-39 and 92-96 indexes signaling a buy. The 35-39 index generated a buy signal within the already existing 92-96 buy, which is bullish. However, if the $68K resistance holds until the end of May, there is a possibility that the 92-96 index could sell, ending the bullish signal.
NEW/Jun14: The 92-96 index has generated a sell signal. Two possible scenarios are now in play. First, a short rally to buy back the 92-96 index, potentially marking the start of a true bull market. Second, a further decline to sell the 35-39 index, which could signal the start of a long-term bear market. In my opinion, the bullish scenario is more probable, but let's see what happens.

COPX - Copper Miners ETF
on 92-96 BUY, OnPath, XXed, 81 days, +23.21% (also, 16-20 on BUY; 35-39 on SELL > breaking to BUY; 92-96 on BUY; 218-222 on BUY; current $44.32)
*comment/May29: COPX is currently in a bullish configuration, with both medium and long-term indices on buy signals, indicating long-term bullishness. The price has broken through the key resistance at $47, confirming the bull market. Based on the contracting triangle pattern forming since the 2021 top, the long-term target is around $80. However, a test of the breakout at $47 is likely a necessary first step before the price moves towards $60 and beyond.
NEW/Jun07: The test of the breakout is underway, as expected, with the price back at the $47 level. If the price fails to rise above this level again, the breakout could prove to be a false one.

DXY - Dollar Index
last signal 16-20 SELL, 2 days, +0.27% (also, 16-20 on SELL > breaking to BUY; 35-39 on SELL; 92-96 on BUY; 218-222 on BUY; current $105.52)
*comment/Apr26: DXY is currently in a bullish SKI constellation. The resistance at $105 has finally been breached, signalling a new upward movement. The next target is $107.13, with a further potential target of $107.64. However, the COT positioning, where the dollar long is excessively crowded, presents a challenge to this scenario.
NEW/May03: Excessively crowded dollar longs have indeed proven to be a problem. It seems the price is now in a correction, likely down to around $103.5.
NEW/May29: It appears that the price correction has touched the support and is now on its way up to challenge the recent highs at $106.49.

GDX - VanEck Gold Miners ETF
on 35-39 BUY, OnPath, NotXXed(true), 68 days, +10.89% (also, 16-20 on BUY; 35-39 on BUY > to SELL 32.53/-2.63% or lower; 92-96 on BUY; 218-222 on BUY; current $33.41)
*comment/Mar19: Both the 35-39 and 92-96 indexes have issued buy signals, forming a double buy scenario. The 35-39 signal is on the path and not XXed. However, typical of such signals, a correction has ensued. It's critical for this correction not to deepen beyond $28; otherwise, both buy signals will conclude and possibly defer the bull market until the latter half of the year. To confirm the bull market a price rise over $32 is necessary.
NEW/Apr08: The price has indeed risen above $32, confirming the bull market. Simultaneously, both the 218-222 and 439-443 indices have triggered buy signals, adding to long-term bullishness.
NEW/May03: 16-20 bought. Is it the end of the correction or the beginning of downward acceleration into a bottom? The 1 down 2 up price pattern across the sector suggests acceleration to the downside, but it's a bull market, so we'll see.
NEW/May10: The 16-20 buy signal sold for a profit, as expected in a bull market. Additionally, the price closed at a new high for this wave, which is bullish. However, the double 1d 2u run pattern and the strong resistance level are concerning.
NEW/May17: The $37 target level has now been reached, marked by the resistance line from the 2020 top. Will the price slice through and then come down to test the breakout, or will this line present strong resistance? The Fibo extensions point to $38.35, $39.16 and $39.96 as possible targets but we will see. However, the current move is likely the fifth of this wave up and should be followed by a significant correction that will probably interact with the 35-39 index.
NEW/May29: The resistance line proved too difficult to break through on the first attempt. Since the $37 target area was reached, it seems reasonable to reduce positions to navigate through the upcoming correction.
NEW/Jun07: The correction continues, and the 16-20 index bought today. Additionally, the price is approaching the first Fibonacci retracement level at $32.96. It seems likely that the 35-39 index will sell before some kind of a low is formed.
NEW/Jun14: The first Fibonacci retracement level was hit intraday on Thursday and Friday, and the 35-39 index is close to selling. The price action still doesn't suggest that a proper bottom is in place. After some short-term bounce, another wave down to hit close to the 50% Fibonacci retracement level ($31.56) is probable.

GDXJ - VanEck Junior Gold Miners ETF
on 92-95 BUY, OnPath, NotXXed(true), 70 days, +15.99% (also, 16-20 on BUY; 35-39 on BUY > breaking to SELL; 92-96 on BUY; 218-222 on BUY; current $41.85)
*comment/Mar19: The 92-96 true bull buy signal has been generated, marking the fourth such signal in the last two months. To sustain this signal, the price needs to remain above $34 for a while and then rise to $40 by mid-April. The ability to surpass this resistance level will determine if the bull market is ready to gain momentum.
NEW/Apr08: The price has indeed risen above $40, confirming the bull market. Simultaneously, both the 218-222 and 439-443 indices have triggered buy signals, adding to long-term bullishness.
NEW/May03: 16-20 buy executed today. Is it the end of the correction or the beginning of downward acceleration into a bottom? The 1 down 2 up price pattern across the sector suggests acceleration to the downside, but it's a bull market, so we'll see.
NEW/May10: The 16-20 buy signal sold for a profit, as expected in a bull market. Additionally, the price closed at a new high for this wave, which is bullish. However, the double 1d 2u run pattern and the strong resistance level are concerning.
NEW/May17: Unlike GDX, GDXJ has already surpassed all trendline resistance from the 2020 top. The next significant target is $52.5, the 2016 bull market top. Like all other gold indices, it appears that the current move is the fifth wave up, so a significant correction should be expected once the top is formed.
NEW/Jun07: The correction continues, and the 16-20 index will buy soon. Additionally, the price is approaching the first Fibonacci retracement level at $40.82. The $40 level, an old resistance, is now being tested from above. There's also a gap at $40.73 that is likely to be closed. If the gold price finds support at $2270, this area looks like a perfect spot for a temporary bottom.

GOLD - Gold spot price
on 92-96 BUY, OnPath, XXed, 170 days, +18.2% (also, 16-20 on BUY > breaking to SELL; 35-39 on SELL > to BUY 2337/+0.26% or higher; 92-96 on BUY; 218-222 on BUY; current $2331)
*comment/Jun14: Gold is in a bullish constellation with a 92-96 buy signal. The 92-96 index is on the path of trades, indicating a potential long-term bull, although it is XXed. The long-term triple buy signal initiated in March 2024 remains active. The gold price hit $2449 intraday on May 20th, which appears to be the top for now. The ongoing correction is targeting $2272 as a minimum.
During the correction, the 16-20 index generated a buy signal, and so far, this signal has marked a low. However, this signal follows a 35-39 sell, so its validity is uncertain. Given the current EW structure, I wouldn't exclude another wave down to properly hit the $2272 Fibonacci level. If the correction extends beyond this level, the next targets are $2217 and $2162, and gold stocks will likely struggle and may revisit the 200-day moving average.

SILVER - Silver spot price
on 92-96 BUY, OnPath, NotXXed(true), 73 days, +22.19% (also, 16-20 on BUY > breaking to SELL; 35-39 on BUY; 92-96 on BUY; 218-222 on BUY; current $29.52)
*comment/Apr08: Silver is in a true bull configuration, with all long and very long-term indices on buy positions. The initial targets following the breakout have been achieved, and now a consolidation phase is expected. After this consolidation, the next upward wave is anticipated to propel the price towards $29.29, where a significant resistance level resides. Breaking through this resistance will be crucial for a potential move towards the all-time high. This progression could unfold over the next 2-3 months if the conditions align. Te support is around $23.5.
NEW/Apr13: The $29.29 target was hit quickly after the breakout, contrary to my expectations. Now the price is at significant resistance. Like the gold sector, every pundit declared this a medium-term top, calling for a significant correction. In my opinion, the correction should be shallow and short. I'll change my mind if an outright equity market crash starts.
NEW/May03: The 16-20 index generated a buy signal. Inside a bull market, this would be a point to add to long positions.
NEW/May10: The 16-20 buy marked a bottom beautifully as it should in a bull market. The consolidation continues, and everything looks bullish.
NEW/May17: $29.29 has been exceeded, and the next target, $31.47—the 161.8% Fibonacci target—was hit intraday, with the spot price closing at $31.43. This is very exciting, but it's time for a top to form, possibly as soon as this week, maybe even intraday Tuesday. However, the expected correction should be shallow and short. Long-term, the price is on its way to $50. Be prepared for significant volatility in silver.
NEW/May29: As expected, the top was reached shortly after my last post. I believe consolidation is now underway, with support around the $29 level.
NEW/Jun14: The first Fibonacci retracement level was hit intraday on Thursday ($28.6), providing an instant rebound. It seems like we will experience some short-term strength here, but I'm not convinced the final bottom is in yet. The probability of this being a bottom will increase if the price can exceed $29.7 and stay above it for two consecutive days.

TIP - iShares TIPS Bond ETF
on 35-39 BUY, OnPath, XXed, 8 days -0.11% (also 16-20 crossed to SELL > to BUY 106.31/-0.55% or lower; 35-39 on BUY; 92-96 on SELL > breaking to BUY; 218-222 on SELL > to NOT BUY 106.4/-0.4% or lower; current $106.9)
*comment/May29: The TIPs chart currently shows a bearish configuration. The 35-39 index is acting as firm resistance, potentially leading to another test of the support at the $105 level. If this support holds, there is a possibility of a bullish double buy signal from the 16-20/35-39 indexes. If the support fails, the next downside target is around $103.8.
NEW/Jun07: The $105 support held, leading to a 35-39 buy signal, but it was then rejected by the 92-96 index resistance. We are now back in no man's land between the $107 resistance and $105 support. Whichever level breaks first will determine the next significant move. A potential breakout will be accompanied by a 92-96 buy signal while a breakdown will be accompanied by a 35-39 sell signal.
NEW/Jun14: The long-term 218-222 index is almost certain to buy next week, and the 92-96 index is breaking to buy as well. At this moment, it feels like TIPS are going to break out of the $107 resistance that has been holding them back since March.

TLT - iShares 20+ Year Treasury Bond ETF
on 35-39 BUY, OnPath, XXed, 8 days, +1.41% (also, 16-20 on SELL > breaking to BUY; 35-39 on BUY; 92-96 on SELL > breaking to BUY; 218-222 on SELL > breaking to BUY; current $94.07)
*comment/May29: TLT is in a bearish configuration with both the 35-39 and 92-96 indexes on sell signals. Since October 2023, the price has been within a contracting triangle and is now nearing the apex around $90. A breakout from this triangle will determine the direction of the next leg. With time running out, we should know the outcome soon, likely within the next three weeks.
NEW/Jun07: The TLT attempted a breakout, but it appears to be failing. It has re-entered the contracting triangle, and if this attempt was a fakeout, we can expect the support to break, leading to higher yields.
NEW/Jun14: My last assessment of TLT action was incorrect. Rather than failing, the drop back inside the contracting triangle seems like a backtest of the breakout. The price is now approaching the 92-96 and 218-222 indices for a potential double buy, which could mark the start of a new leg up to the target area around $100 and then further to $106 (if and when).

UCO - crude oil ETF
last signal 35-39 SELL, 25 days, +0.81% (also, 16-20 on BUY > breaking to SELL; 35-39 on SELL; 92-96 on BUY; 218-222 on BUY; current $31.29)
*comment/Mar25: Contrary to expectations, the price has risen and the 92-96 index generated a buy signal, complementing the existing 35-39 buy signal and turning the structure bullish. Such signals often mark temporary tops. The upcoming correction will determine if this trend will evolve into a bull market or revert to a trading range, with the next target around the $22 area. The SKI structure is promising for a bullish outcome, but only time will tell.
NEW/Apr08: The 92-96 buy signal has proven to be bullish, with the price rising by 10% since its inception. With the 218-222 also on buy signal and 439-443 breaking to buy it may be time to start buying dips.
NEW/May10: The 92-96 buy signal that looked bullish is now in the red with the 35-39 index selling. It seems that support around $29 will be tested before we will be able to know what is happening in the longer term.
NEW/Jun07: The $29 support is being tested, as expected. If it cannot hold $25 will be the next downside target.
NEW/Jun14: The $29 support held, and the price is bouncing towards the upper boundary of the downtrend channel. I don't think the bottom is in yet. The $32.2 resistance needs to be cleared before we can discuss a change of trend.

URA - uranium stocks ETF
92-96 SELL executed today (also, 16-20 on BUY; 35-39 on BUY > breaking to SELL; 92-96 on SELL > breaking to BUY; 218-222 on BUY; current $29.56)
*comment/Sep25: URA is in a bull market. The start of the bull was marked by a triple buy signal 16-20/92-96/218-222.I sold my initial buy, reducing it to just the core position (still substantial) and will let it run. I plan to buy back a trading position again if prices retract to the support area.
NEW/Mar19: Since my last update, I've accumulated 75% in my trading account. Most of these positions were acquired below their 50-day moving average (MAV), and I plan to trade around them as they reach this level on the way up. I remain uncertain whether the bottom will be tested again.
NEW/Apr08: The 35-39 buy signal has occurred again within the 92-96 buy signal. While this may be the start of a new up-leg it also can be a part of a reset for the bull run. I'm currently 75% committed in my trading account but prepared to sell if the $29 support is breached. If the 92-96 signal is tested and holds, I'll consider adding to a 100% trading position.
NEW/May09: The 92-96 index support has been tested and held, but I'm still hesitant to go all-in until we can sustainably move beyond $32.
NEW/Jun07: The 92-96 buy signal is in jeopardy again. It feels like the uranium market needs a reset, and if the current level cannot hold, that might be exactly what we get. If the 92-96 cannot hold, the first downside target is $27.13.
NEW/Jun14: The 92-96 buy signal has officially ended today. If the price immediately turns around and rallies, a new true bull buy signal will be generated for another long-term rise. However, I believe this market needs a proper reset, which would occur if the price hits the Fibonacci retracement level at $27.13 and then probably further down to $25.54. I am 25% long now, that is my core and will not sell further.

USERX - US Global Investors Gold & Precious Metals Fund
on 92-96 BUY, OnPath, XXed, 124 days, +14.17%; run pattern in-progress 1D/1U/+0.72%perday; xxing=off_off_on (also, 16-20 on BUY > breaking to SELL; 35-39 on BUY > breaking to SELL; 92-96 on BUY; 218-222 on BUY; current $11.12)
*comment/Apr22: USERX is on an XXed 92-96 buy signal, suggesting a potential bull market. Following the buy signal, a rally ensued, leaving USERX in a strong short-term position. However, a correction/consolidation was initiated post reaching $11.2. My focus is now mainly on weekly charts, which do not indicate any significant overbought conditions. Nevertheless, my perspective may alter if there's an outright crash in the equity market. The correction target is $10.28, possibly briefly extending to $9.9.
NEW/Apr26: The previous top at $11.21 has been breached, suggesting a possible start of a new leg up. However, there's a potential problem: the current price pattern is 1 down followed by two small up days, which is one of the most bearish run patterns. The pattern will be confirmed if on Monday USERX closes down. Considering the state of the equity market and the potential for a significant drawdown, I'll likely lighten up my position if Monday is a down day.
NEW/May03:Instead of on Monday, the 1 down 2 up bearish price pattern was confirmed on Friday. In a bull market, the 16-20, which is about to buy, should act as support, so I am uncertain about the short-term scenario. I'll probably take profit on my newly acquired positions and go back to 50% on Monday morning and wait.
NEW/May09: USERX has exhibited another 1d 2u run pattern. It remains to be seen whether this will have a more significant impact or if we will continue consolidating until a new upward trend begins.
NEW/May10: USERX price printed a higher close, setting up a potential 1d 2u again if Monday closes down. Nothing has been broken yet, quite the opposite, but if the 1d 2u happens for the third time in a row I don't know if I should be worried or annoyed.
NEW/May17: As I suspected, the recent tape action was not bearish. My concern about the triple 1d2u pattern obscured what is now apparent: the action was outright bullish. Today, a quick scan of the gold market on Twitter reveals that most analysts are doubling down on their correction calls, suggesting the price will likely continue to rise. In hindsight, the triple 1d2u marked an important juncture, as SKI signals often do. Unfortunately, my fear prevented me from interpreting it correctly.
NEW/May21: The USERX price is nearing resistance at $12.5, coinciding with the 881-885 index, which currently echoes March 2021 prices as they moved off the 2020 top. If we consider the 881-885 index as the true resistance to overcome, the price should be at least around $14.5. However, given that gold was around $2000 at that stage and is now $2400, projecting this into the USERX price suggests it should be at least around $20. There's a significant amount of catching up to do, which explains why the USERX price remains so resilient even when gold is weak on the day.
NEW/May24: The best possible scenario for this correction would be for the 16-20 index to buy, initiating a small rally back above $12 for a double top, followed by a trading range between $10.8 and $12.0 for about two months before overcoming the resistance in the second half of the year. The other scenario is a straight drop to $10.28 to test the breakout, followed by a slow grind out of the low to eventually break out again in the latter part of the year. If the price falls below $10.28, it could challenge the bull market by mid-summer.
NEW/Jun07: The USERX 16-20 index will finally buy. It seems like the $10.74 Fibonacci retracement is the target now. If this happens, the 35-39 index will likely sell, potentially marking a bottom somewhere in the $10.28-$10.6 range. Referring to the May 24th post, it appears that one of the two scenarios described is unfolding. Personally, I'd prefer the second scenario where we test the $10.28 level right now. In both cases, we will likely not reach new highs before the latter part of the year.

XGD.AX - Australian gold index
on 92-96 BUY, OnPath, NotXXed(true), 66 days, +7.74% (also, 16-20 on BUY > breaking to SELL; 35-39 on SELL > breaking to BUY; 92-96 on BUY; 218-222 on BUY; current $7326)
*comment/Mar15: XGD.AX is currently on a true bull buy signal.
NEW/Apr13: After Friday's session, I decided to take profits on the 10% that I purchased two weeks ago. I'm retaining the remaining 50% trading position as I believe this correction is unlikely to be significant in depth or duration. I plan to buy on dips. Nevertheless, I acknowledge that my stance could shift if the equity market undergoes an outright crash. For that reason, I have tightened up the stops.
NEW/Apr22: The recent action validates my decision to reduce to 50%; the correction persists. I still anticipate modest depth and duration, unlikely to surpass the old resistance zone at $7000, if it reaches there at all. More likely correction target: $7100-$7300 range. I'll begin adding positions once the price reaches this level.
NEW/Apr26: So far, my prediction about the correction being shallow has been accurate. The lowest price reached was $7408, which didn't quite hit my buying zone. I did make some purchases, but only a small position, so I am currently 55% long. If USERX confirms a 1 down 2 up pattern on Monday, I might again go back to 50% or even lower on Tuesday.
NEW/May03: Consolidation persists, with the 16-20 about to buy. The price still hasn't entered my buying zone ($7100-7300). USERX has confirmed the bearish 1 up 2 down run pattern, so I will take profits on my recent buys and wait at 50% long to see what unfolds in the next few days.
NEW/May10: 16-20 buy signal acted as support as it should. That is bullish. I added some to my longs on Friday morning, 65% long but cautious regarding the triple 1d2u run pattern.
NEW/May17: If not for USERX's bearish run pattern, I would have gone 100% long. I added to my silver positions (IVR.ax SVL.ax), as I announced, so all is good. 65% long. We'll see how Monday trading day goes here in Australia, it seems like a big breakout will finally happen and we detach from that $7700 level that has been an obstacle since more than a month ago.
NEW/May29: XGD.AX executed an 881-885 index sell today. The price is oscillating around the critical $7700 level, suggesting a box range consolidation.
NEW/May30: XGD.AX is about to sell the 35-39 index during a 92-96 bull market. The next time the 35-39 buys back it will be an all-in signal. For now, the correction/consolidation is ongoing.
NEW/Jun07: XGD is still in a trading range of $7400-$8100. That is likely to change now after the NY session on Friday. My buying zone is in $7100-$7300. But first, let's see if we get there. I'm currently 75% long but will put the hedge back on Monday.
NEW/Jun14: XGD hit the first Fibonacci support. Intraday, it dipped as low as $7267, which is within my buying zone, but my bids were too conservative, so none of my orders were executed. I'm still 75% long. On Monday, I will try again.
