email: branko.askovic.ale@gmail.com
X: BMGold @Brankoasko93725
USERX

USERX long indices

XGD.AX

XGD.AX long indices

email: branko.askovic.ale@gmail.com
X: BMGold @Brankoasko93725
email: branko.askovic.ale@gmail.com
X: BMGold @Brankoasko93725


email: branko.askovic.ale@gmail.com
X: BMGold @Brankoasko93725
SandP 500, on 92-96 BUY, OnPath, XXed, 93 days, +20.03%; (also, 16-20 on SELL; 35-39 on BUY; 92-96 on BUY; 218-222 on BUY; current $5218)
*Comment/Dec29: The S&P is currently exhibiting a bullish configuration. The recent 92-96 buy signal marked the beginning of a rally that brought the price close to the old all-time high at $4818. While short-term overbought conditions could potentially lead to a correction, the long-term structure now appears to be bullish. However, at this moment, I'm not inclined to actively pursue the upward trend. Instead, I'm considering reevaluating my position after a potential correction has occurred.
NEW/Jan19: Unfortunately, the correction didn't go deep enough to get me interested in establishing a long position. The price action remained sideways until it touched the 16-20 index back prices, followed by an explosive upward movement, which is characteristic of bull markets. Today, the price closed at a new all-time high. The Commitment of Traders (COT) readings are neutral, and the long-term SKI indices are on buy signals. Thus, everything on this chart points to a continuation of bullishness.
NEW/Mar13: The rally appears to be getting long in the tooth. I'm waiting for a break of support to consider entering a short position once more.
HUI, on 92-96 BUY (with 35-39 for a double buy), OnPath, NotXXed(true), 10 days, +1.02% (also, 16-20 on SELL; 35-39 on BUY; 92-96 on BUY > breaking to SELL; 218-222 on SELL; current $231.97)
*comment/Mar11: Simultaneous 92-96 and 35-39 buy signals were generated today for a double buy, with 92-96 on the path and not xxed therefore indicating a true bull market. However, I'm cautious and see these signals as part of forming a bottom. The breakout into a bull market isn't confirmed until at least $250 is broken, but more probably $270. Nonetheless, upward pressure persists, with the next target at $250. A healthy consolidation around $230-235 is desirable.
NEW/Mar25: Consolidation is indeed underway. The 92-96 index back prices will dip to around $210 over the next seven days. In this period the price is allowed to drop as low as $220 and the buy signal will remain intact, but it will then need to rise above $245 by April 10th to avoid rising back prices.
$NDX - Nasdaq, on 92-96 BUY, OnPath, XXed, 95 days, +19.49% (also, 16-20 on SELL > breaking to BUY; 35-39 on BUY; 92-96 on BUY; 218-222 on BUY; current $18277)
*comment/Dec29: The chart is currently displaying a bullish configuration. The recent 92-96 buy signal aligning with the breakthrough of the resistance line enhances its potential impact. An all-time high has been achieved, but in the short term, the price appears to be significantly overextended and possibly in overbought territory.
NEW/Jan19: The bull run persists. The manner in which the price engaged with the 16-20 index back prices suggests more of the same in the future.
NEW/Jan26: SKI-wise, there haven't been any changes compared to my previous comment. In the short term, there is a lag in the performance of NDX compared to SPX, which might indicate the development of a short-term top. However, the fact that speculators have reduced their COT position is not consistent with the formation of a top. The pattern to watch for would be the speculators buying into the rally while NDX lags behind SPX. I am on the sidelines, waiting.
NEW/Mar13: The rally appears to be getting long in the tooth. I'm waiting for a break of support to consider entering a short position once more.
$RUT - Russell 2000, on 35-39 BUY, OnPath, NotXXed, 19 days, +1.66% (also, 16-20 on SELL > breaking to BUY; 35-39 on BUY; 92-96 on BUY; 218-222 on BUY; current $2074)
*comment/Feb16: The chart is currently displaying a bullish configuration. The 35-39 buy signal from November 2023 has sold and instantly bought back, while the 92-96 index is on a buy signal. This signal is occurring just below the upper boundary of the upward-sloping trending channel dating back to the 2022 low. However, this 35-39 signal could either mark a top or signify the beginning of acceleration. Based on the current structure, I am leaning toward a scenario where it marks a top, potentially leading to a correction, with a minimum target around $1850. If this prediction holds true, the correction may end with the price testing the support of the 92-96 index, at which point the future direction of this market will become clearer.
NEW/Feb27: The 35-39 buy signal generated on February 14th did indeed mark a top, followed by a minor correction. This correction subsequently reversed back to a 35-39 buy signal. The prevailing pressure seems to be on the upside. However, to confirm the start of a new upward trend, the $2070 level needs to be surpassed. If this level is successfully breached, the initial target will be $2150, with the ultimate target set at $2350.
NEW/Mar13: The $2070 resistance level has persisted for the past three weeks, while support is also holding near this level. A resolution seems imminent, with either a breakout above $2070 leading to a rally or a downturn below $2060 signalling a correction towards $1870ish.
$TNX - 10Y yield, on 35-39 BUY, OnPath, XXed, 31 days, +1.58% (also, 16-20 on BUY > breaking to SELL; 35-39 on BUY; 92-96 on SELL; 218-222 on BUY; current 4.25%)
*comment/Mar19: The SKI chart currently exhibits a bearish configuration, but the technical support around the 3.9% level remains resilient, delaying confirmation of the bearish trend. Although the top observed in February initially signalled a continuation of the downtrend, the price reversed upwards, now testing that same top at 4.3% again. If the price surpasses this level, the target could shift to 4.5-4.6%, potentially prompting a bullish reversal in the SKI chart. More clarity on the chart's state is expected following the FOMC meeting tomorrow.
NEW/Mar25: The 4.3% resistance level is holding. If the next signal is a 35-39 sell, I expect the 4% support to be tested. The recent FOMC meeting was negative for yields (so far).

XAU, on 92-96 BUY (double buy with 35-39), OnPath, NotXXed(true), 10 days, +1.65% (also, 16-20 on SELL; 35-39 on BUY; 92-96 on BUY; 218-222 on SELL; current $120.03)
*comment/Mar19: Both the 35-39 and 92-96 indexes have issued buy signals, forming a double buy scenario. The 92-96 signal, is on the path and not XXed, therefore marking the potential for a true bull market. However, typical of such signals, a correction has ensued. It's critical for this correction not to deepen beyond $110; otherwise, both buy signals will conclude, returning us to the downtrend channel and possibly deferring the bull market until the latter half of the year. To confirm the bull market a price rise over $130 is necessary.
ASA, on 92-96 BUY, OnPath, XXed, 41 days, +2.38% (also, 16-20 on SELL; 35-39 on BUY > breaking to SELL; 92-96 on BUY; 218-222 on SELL; current $15.04)
*comment/Mar25: ASA is in a bullish setup with both the 35-39 and 92-96 indexes on buy signal. Confirmation of a bull market requires a close above $15.5 by early April or the 92-96 signal will end. Falling below $14.2 could delay the bull market until later in the year.
BITCOIN, on 35-39 BUY (while on 92-96 buy), OnPath, Not XXed(true), 51 days, +64.21% (also, 16-20 on SELL > to BUY 66114/-5.42% or lower; 35-39 on BUY; 92-96 on BUY; 218-222 on BUY; current $69902)
*comment/Mar22: BTC is in a bull market, with both the 35-39 and 92-96 indexes on a buy signal. Following the attainment of a new all-time high, a correction has commenced. It appears that more time is required for the upward trend to resume, possibly after testing the $58K support level.
COPX (copper miners ETF), on 92-96 BUY, OnPath, XXed, 24 days, +14.26% (also, 16-20 on SELL; 35-39 on BUY; 92-96 on BUY; 218-222 on BUY; current $41.1)
NEW/Dec29: COPX is in a bullish configuration. In the broader context, since the 2021 peak, the pattern resembles an ascending triangle with a horizontal resistance zone between $42 and $44, and a rising support level currently at around $35. The presence of both the 35-39 and 92-96 buy signals, in addition to the S&P 500 bull market, indicates support for the price to potentially reach the resistance area within the coming 4 weeks ($42-$44). In the short term, it's worth noting that the recent 92-96 buy signal might have marked the commencement of a minor correction.
NEW/Jan09: As expected, the 92-96 buy signal marked the start of a correction. It now appears that the correction might be more substantial than initially anticipated, possibly triggering a 92-96 sell signal. However, my bullish outlook for the next few months remains unchanged as long as the price stays above $35 and the 35-39 index doesn't sell. As long as these conditions are met, the current price fluctuations are viewed as setting the stage for a breakout.
NEW/Jan12: 92-96 index sold indeed. Read my comment above.
NEW/Feb12: The 35-39 index has sold, yet the price remains within the ascending triangle described earlier. Additionally, there is a potential for a 92-96 index buy signal to mark a short-term rally back to the upper boundary of the triangle. However, if the price closes below the recent low of $34.46, it should be regarded as a breakdown with an initial target of around $42.
NEW/Feb23: The 92-96 index did indeed generate a buy signal. While it is xxed and may mark a top, the SKI structure appears solid. Unless there is a rapid decline starting immediately, the signal could persist. Currently, I wouldn't consider this signal as a buy, but if it is followed by a new 35-39 buy signal (not expected), I might reconsider.
NEW/Mar06: Unexpectedly, the 35-39 buy signal has been generated. This is considered bullish, with an initial target in the $40-41 area. There is notable resistance at this level, and if overcome, it could pave the way for a surge towards $47.
NEW/Mar19: As anticipated, the 35-39 buy signal initiated a price ascent towards the target range of $40-41. A subsequent consolidation or correction, not exceeding $37, is anticipated before attempting to breach the resistance level again. If successful, a rise to $47 is expected.
DXY (dollar index), on 35-39 BUY, OnPath, NotXXed(true), 4 days, +0.79% (also, 16-20 SELL executed today > breaking to BUY; 35-39 on BUY > breaking to SELL; 92-96 on SELL; 218-222 on BUY; current $104.23)
*comment/Dec29: DXY is presently demonstrating a bearish SKI and technical analysis (TA) setup. However, it's important to note that the price is currently positioned just above a long-term support level that dates back to the 2011 low. Given that the current TA indicators are all in a deep oversold territory, it's unlikely that this support will be breached in the short term. Additionally, there's a possibility of a short-term dollar rally, potentially targeting the $105-106 range. As part of my strategy, I may consider taking a short position in gold during this dollar rally, which can also serve as a hedge against my long gold positions.
NEW/Jan09: So far, the correction rally has reached $103.1. I believe there's more upside potential, at least to $104 and possibly beyond, as I mentioned previously.
NEW/Jan26: A new high for the correction rally has been achieved, $103.82. This produced a 35-39 buy signal but it is xxed and therefore should represent a resistance.
NEW/Feb02: The 35-39 index did, in fact, pose strong resistance. Now, let's observe if the $101 support level will be tested again.
New/Feb07: Eventually that 35-39 index resistance broke and a 35-39 buy signal was generated. This is potentially a bullish development but it still needs confirmation by a close above $105. If $105 resistance breaks a rise to $107 should be expected.
NEW/Mar01: It has been a month since the 35-39 buy signal, and the confirmation, indicated by the price closing above $105, has not yet materialized. Today's 16-20 xxed buy signal could potentially indicate further weakness.
NEW/Mar19: A new 35-39 buy signal, is generated after the previous one failed, and the price threatens to surpass the resistance at $105. Clearing this level is crucial to confirm the bullishness of the signal. However, I still anticipate this level to act as resistance. If it doesn't, a new 92-96 buy signal will likely be triggered with a price rise above $105, signalling the beginning of a bull market for the dollar.

GDX, on 35-39 BUY, OnPath, NotXXed(true), 11 days, -1.0% (also, 16-20 on SELL; 35-39 on BUY; 92-96 on BUY > breaking to SELL; 218-222 on SELL; current $29.83)
*comment/Mar19: Both the 35-39 and 92-96 indexes have issued buy signals, forming a double buy scenario. The 35-39 signal is on the path and not XXed. However, typical of such signals, a correction has ensued. It's critical for this correction not to deepen beyond $28; otherwise, both buy signals will conclude and possibly defer the bull market until the latter half of the year. To confirm the bull market a price rise over $32 is necessary.
*comment/Mar19: The 92-96 true bull buy signal has been generated, marking the fourth such signal in the last two months. To sustain this signal, the price needs to remain above $34 for a while and then rise to $40 by mid-April. The ability to surpass this resistance level will determine if the bull market is ready to gain momentum.

GLD, on 92-96 BUY, OnPath, XXed, 106 days, +9.85% (also, 16-20 on SELL; 35-39 on BUY; 92-96 on BUY; 218-222 on BUY; current $200.99)
*comment/Mar19: GLD has shifted to a bullish setup with a double 35-39/92-96 buy signal. The 92-96 index is on the path of trades (potential long-term bull), although it is XXed. The long-term triple buy signal initiated in March remains active.
The gold spot price closed at an all-time high on March 1st, hitting $2083. This marks the seventh time since April 2023 that it entered the $2060-2100 range. Unlike previous instances, this breakout was not followed by sharp sell-offs. With support around the $2060 level, the initial target of $2200 has already been achieved. Ultimately, the target for this move, based on the inverse head and shoulders pattern, is $2521, before a larger correction may occur. The only piece missing in this overall bullish picture is the gold stocks breakout which should come in time.

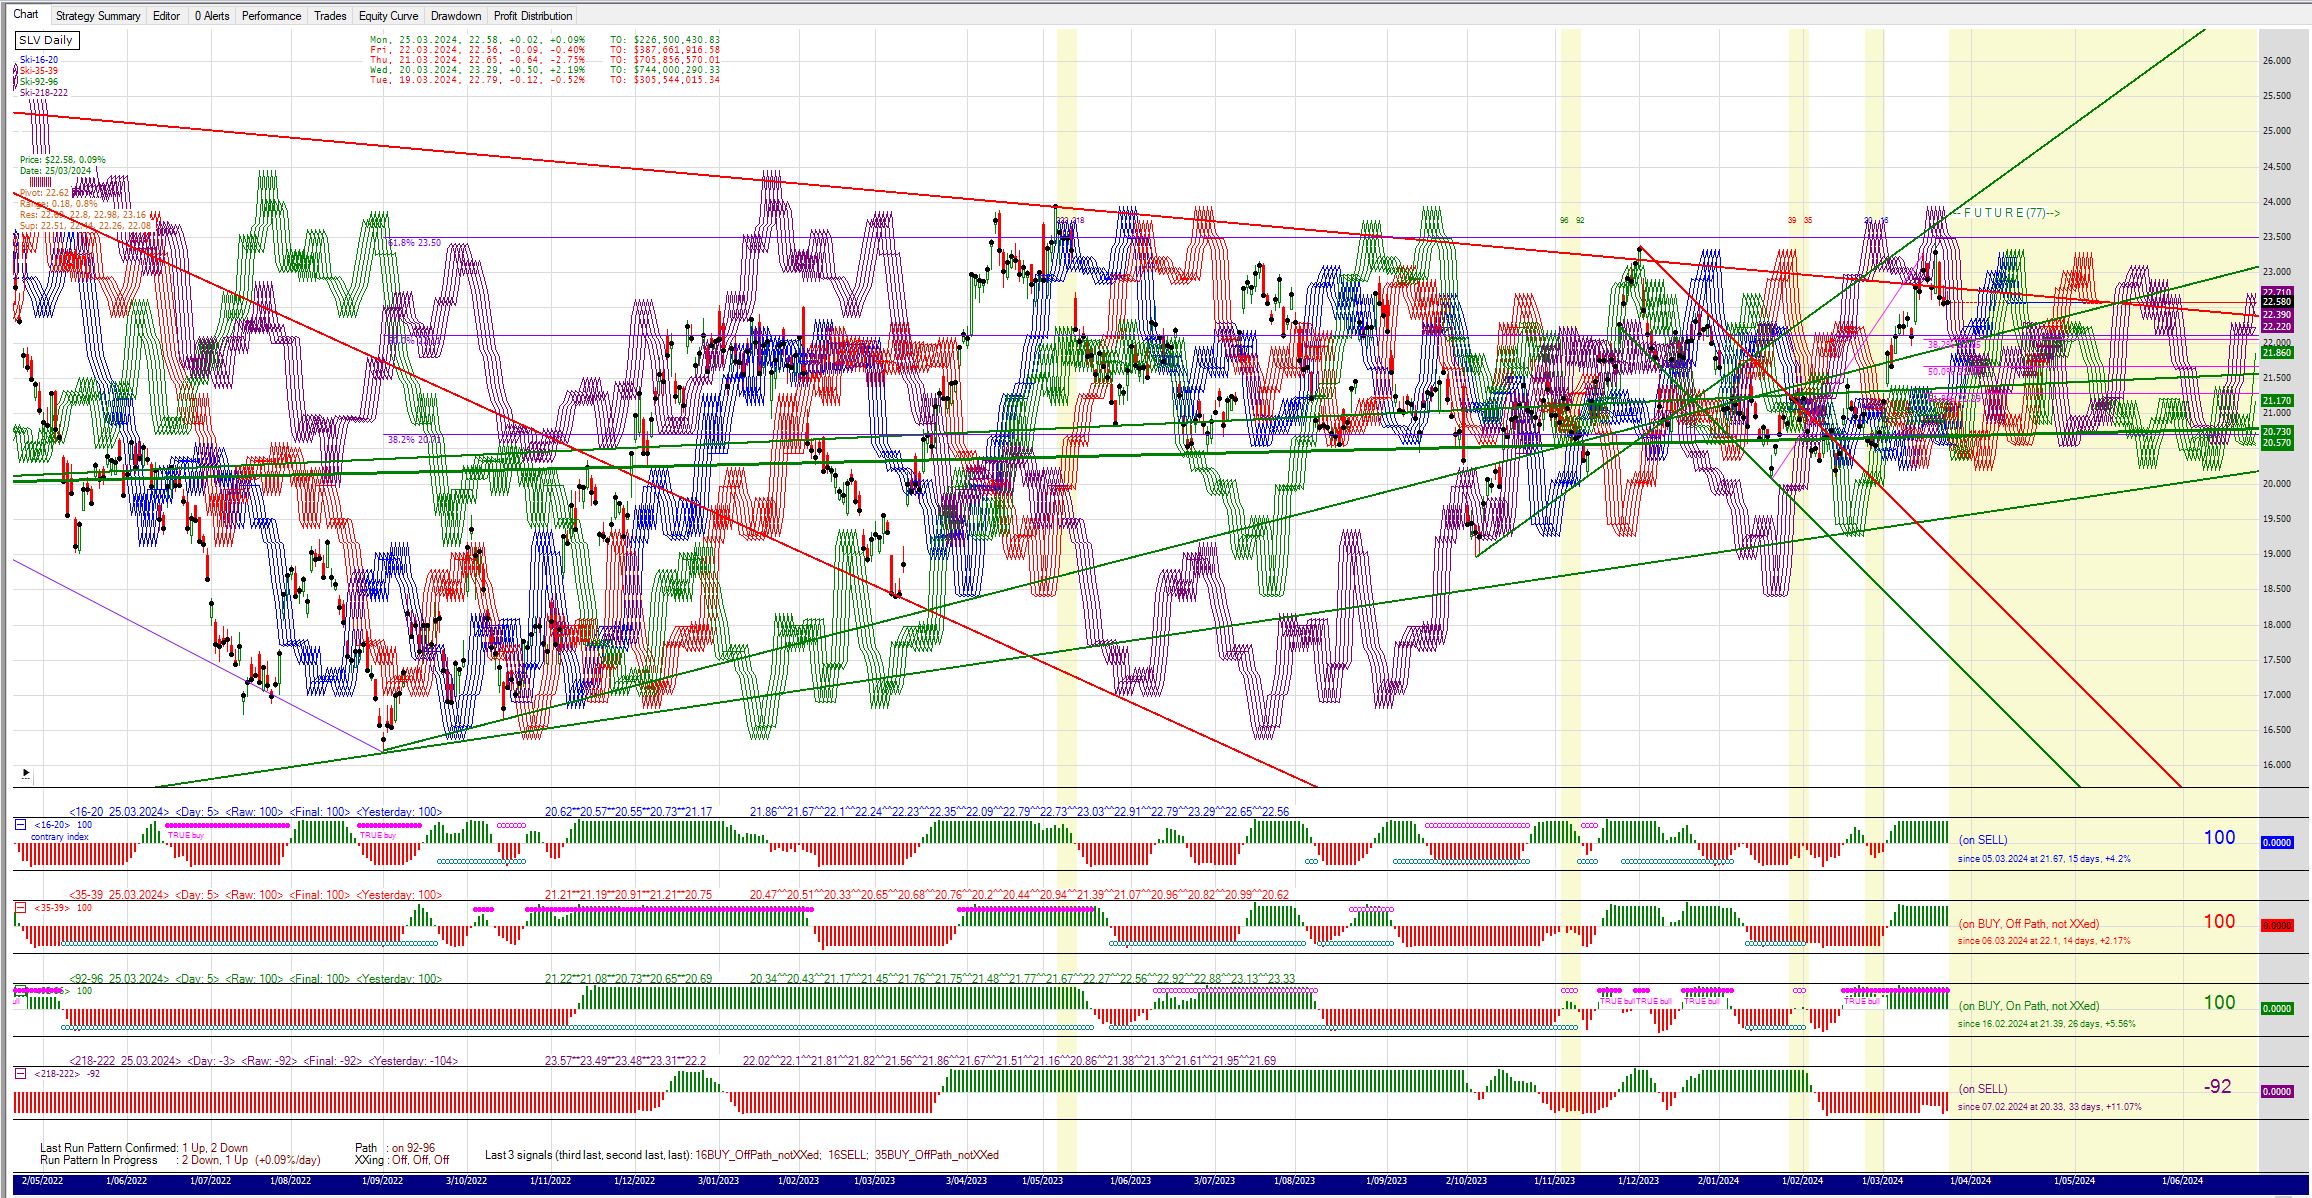
SLV, on 92-96 BUY, OnPath, NotXXed(true), 26 days, +5.56% (also, 16-20 on SELL; 35-39 on BUY; 92-96 on BUY; 218-222 on SELL > breaking to BUY; current $22.58)
*comment/Feb16: A drop during last week triggered a 92-96 sell signal, followed by a surge to buy the 92-96 back for a true bull buy signal. The SKI structure appears solid. This development occurred around the critical level of $20.5 and broke through the downtrend line stemming from the December top, adding further significance to the signal. Currently, it seems that a rally has commenced, targeting around $23 by the end of March. If this scenario proves incorrect, setting a stop loss at the occurrence of a 92-96 sell signal is advisable.
NEW/Mar01: The interaction between the back prices of all three indexes and the price of SLV suggests that something significant is unfolding. While the 92-96 true bull signal was initially under pressure to sell, today's rise indicates the potential to avoid this sell signal. Such an outcome would be remarkably bullish. To prevent the sell signal, the price only needs to reach $21.4 in the next few days. However, if this scenario doesn't materialize and the price falls short of this target, there is a possibility of a triple sell signal (16/35/92), likely driving the price straight down to $19.75 and potentially even lower.
NEW/Mar06: The bull signal has indeed persisted. The final confirmation of the bull market will occur with a rise over $22.75, which would trigger a 218-222 buy signal. Support is established around $21.25, as indicated by the 92-96 index.
NEW/Mar19: The price surged to the crucial resistance level at $22.75 (see chart), triggering the 218-222 index to start breaking towards a buy signal. Given the rapid rise, the price is currently overextended in the short term, suggesting a potential correction to around $21.6 before another attempt to break out. However, if the price drops below $20.8, it could signal trouble for the bullish case.
TIP, last signal 35-39 SELL, 6 days, +0.74% (also, 16-20 on SELL > breaking to BUY; 35-39 on SELL > to BUY 107.85/+0.78% or higher; 92-96 on BUY; 218-222 on SELL; current $107.01)
*comment/Mar19: The TIPs chart currently shows a bullish configuration, although the 92-96 buy signal is currently off the path. The signal indicated a temporary high and also marked the recent low at $102 as the medium-term bottom. Since then, the price has been moving sideways within a tight range of $105-$108. A breakout from this range will provide clarity on the direction of the next leg.
TLT, on 92-96 BUY, OnPath, NotXXed(true), 44 days, -0.42% (also, 16-20 crossed to BUY > to SELL 94.18/+0.72% or higher; 35-39 on SELL > breaking to BUY; 92-96 on BUY; 218-222 on SELL; current $93.51)

UCO (crude oil ETF), on 35-39 BUY, OnPath, XXed, 39 days, +8.79% (also, 16-20 on SELL; 35-39 on BUY; 92-96 on BUY > to SELL 28.53/-12.38% or lower; 218-222 on BUY; current $32.56)
*comment/Mar25: Contrary to expectations, the price has risen and the 92-96 index generated a buy signal, complementing the existing 35-39 buy signal and turning the structure bullish. Such signals often mark temporary tops. The upcoming correction will determine if this trend will evolve into a bull market or revert to a trading range, with the next target around the $22 area. The SKI structure is promising for a bullish outcome, but only time will tell.

URA (uranium stocks ETF), last signal 16-20 SELL (inside off path 92-96 BUY), 3 days, -1.94% (also, 16-20 on SELL > breaking to BUY; 35-39 on SELL; 92-96 on BUY; 218-222 on BUY; current $28.38)
NEW/Oct04: I am building a trading position again. 25% long.
NEW/Nov20: I am worried about the Aussie uranium stocks not following the USA counterparts' breakout. I am 50% long.
NEW/Dec14: It appears that Aussie stocks have potentially reached the bottom of the correction. I've added to my position, and now I'm 75% long, with all positions in Aussie stocks (DYL, BOE, BMN, PDN, AGE).
NEW/Jan12: The price fell short of selling the 35-39 index by one day. Instead, it surged strongly to break through the recent high which is typical bull market behaviour. I am happy with my position and letting it run for now. However, the $32 level could be a strong resistance for a while.
NEW/Feb12: The $32 resistance level has proven to be a formidable barrier, suggesting that some form of consolidation or correction may be necessary to reload and recharge. In light of this, I've taken some profits (not all) and am now seeking to re-enter at lower levels. 50% long.
NEW/Feb16: I kept selling into strength throughout the past week to further lock in profits, reducing my trading position to 25% long. I intend to persist with this strategy until I return to my core position.
NEW/Mar01: As I said two weeks ago I sold all my old positions and am now buying back at support (Aussie stocks, BOE, PDN, DYL and BMN). 50% long (excluding core which I do not touch) but I will trade around these positions until I am sure that the bottom has been in place.
NEW/Mar06: I've realized short-term profits and have reduced my position to my core holdings. Now, I'm preparing to begin accumulating again.
NEW/Mar19: Since my last update, I've accumulated 75% in my trading account. Most of these positions were acquired below their 50-day moving average (MAV), and I plan to trade around them as they reach this level on the way up. I remain uncertain whether the bottom will be tested again.
USERX, on 92-96 BUY, OnPath, XXed, 67 days, +1.64%; run pattern in-progress 2D/1U/+0.51%perday; xxing=off_off_on (also, 16-20 on SELL; 35-39 on BUY; 92-96 on BUY; 218-222 on SELL; current $9.9)
*comment/Mar19: The recent generation of the 92-96 buy signal has put the USERX chart in a bullish SKI configuration, suggesting a potential bull market. After a rally that followed the buy signal, USERX remains in a strong short-term position. If a consolidation or correction occurs in the next few weeks, there is enough room before the support is hit, with $9.2 serving as a key level. However, it's important to note that USERX has yet to confirm a bull market until the $10.28 resistance is surpassed, warranting caution.


XGD.AX, Australian gold index, on 92-96 BUY, OnPath, NotXXed(true), 11 days, +1.8% (also, 16-20 on SELL; 35-39 on BUY; 92-96 on BUY > breaking to SELL; 218-222 on SELL; current $6922)
*comment/Mar15: XGD.AX is currently on a true bull buy signal. However, further upward movement is required to prevent a return to the bear trend.
Generation of the signal has initiated a consolidation phase (as expected), which has been relatively mild thus far (good) but may not be sufficient to maintain the bullish stance. To confirm the bullish trend, a breakout above the $7000 resistance level is necessary, with a target of at least $7500 by the first week of April. However, trader sentiment appears overly optimistic, and gold's COT positioning is nearing overcrowded levels, making such a move less likely. If it happens regardless it will be proof that this signal is for real.
If the market struggles and the consolidation transforms into a correction, support at the $6600 level will be crucial. A failure to hold this level could result in a retest of $6000-6100, delaying the bullish outcome to the second half of the year.
I am 50% long and happy to stay that way if the next move is to the upside. If the $6600 cannot hold I will be reducing my position.

email: branko.askovic.ale@gmail.com
X: BMGold @Brankoasko93725


