Sunday, 17 May 2020

Quick update

There was some constructive development in the gold sector last week.

USERX
USERX did the necessary to rectify the weaknesses of the current bull signal. It rose above the pre-crash high of 10.61 and it did it in a quite spectacular fashion. The price is back in the uptrend channel which started in June last year and the most important thing the SKI indices are taking the proper order for further advance. For now, the trend is up and the first stop is at 11.82. Longer-term target is at 13.75.

XGD Australian gold index
XGD clearly broke out of the resistance and is now in a bullish ascent. The obvious target is the  Aug 2019 all-time high at 8730.


GLD
GLD closed at the new high for the year 163.93. Last time I said I am not convinced the price is going to push and stay above this high in the next month or two. I am still not convinced but I will not fight the tape. Next target 174.00


SLV
Silver is finally playing catch-up. Next target 16.3.


HUI
HUI broke above the 2016 high. It needs to hold there on Monday to confirm the breakout. Medium-term target 372.74.


XAU
XAU is in a bullish configuration, it has cleared all resistance and is holding the trend. Target 140.94.


GDX
GDX is also in a bullish configuration, it has cleared all resistance and is holding the trend. Immediate target 39.08, longer-term 55.25.


GDXJ
GDXJ is similar to the USERX, it has just broken above the pre-crash high and is setting up a bullish configuration. It still needs to go above the 2016 high at 52.5 so that would be the first target.

S and P 500
SandP has a very firm resistance at 3000 and, at the moment, it seems like it is rolling over. I assume that the breakdown bellow 2727 could start the new leg down towards the 35-39 sell. This breakdown could also mark a medium-term top in the gold stocks.


TLT
Unlike the gold, the bonds haven't broken out of the symmetrical triangle that prevents the price advance. Failure to do so will trigger a 35-39 sell signal that could lead to further weakness.


UUP
The dollar is still undecided. At the current price level, it will generate a 16-20 buy on Monday and by the end of the week it could also buy back the 35-39 index for a double buy. That could mark the beginning of a new bull phase.


Bitcoin
Bitcoin had a spectacular 2 months rise which set up a possibility for a new true bull signal in about week or two.


Inflation
There is no evidence that this advance in gold is driven by inflation expectations.


I haven't changed my position from the last week. I am 100% long and will lighten up if and when the targets are hit.

Good luck to all.
Branko


Sunday, 10 May 2020

Waiting for decoupling between gold and general market

The analogy between the recent market crash and the one from the year 2008 seems over. The initial crash was almost identical but the recovery had significant differences. In 2008 the recovery was weak and quickly followed by more selling pressure to test the lows. Today, the recovery took V shape, the price of gold and most of the gold indices are above the highs preceding the crash. The general market recovery is also much stronger and longer than in 2008 and the price of the S and P 500 had recovered 61.8% of the losses.
The gold market and the share market seem to trade in synch and this is a problem for me. We still haven't tested the recent lows and we haven't seen the decoupling between the two markets. Also, it is still not clear where the dollar is going and that is a crucial part of the big picture because the dollar will decide if we are entering a deflationary or inflationary period.

USERX
After the crash, the USERX price rallied then had a small correction and then shot up through the 16-20, without any meaningful resistance, all the way to buy the 92-96 and the 35-39 echo. This kind of behaviour characterises impulse waves but I still have issues with this chart. I explained them in my last post: need to break out of the recent high, 92-96 on the rise, 'end of the rally' configuration and need for decoupling from the GM. Most of these issues will be resolved if USERX manages to close above the 2016 high by the end of the upcoming week. Can it do it? Probably, if the GM holds for another week. The other and possibly more probable scenario is a sideways to down move to sell the 92-96 then buy the 16-20 and the 92-96 for the breakout and renewed bull market.

USERX weekly
From the weekly chart, we can see that if a more significant correction is about to start the target would be around 8.77-9.0.


GLD
GLD is in a bullish configuration and on the edge of giving a 16-20 buy signal. The short term configuration looks positive for another push up to try to clear the recent high at 164.42. When we look at the weekly however it seems to me that holding above the 164.00 is not very feasible at this stage. It is more likely that we stay bellow for another month or two. If we manage to break through and stay above then the next target would be around 174.00 (2012 high). 

weekly
 

XGD - Australian gold index
I sold my gold shares on Thursday before the Easter holidays in an expectation that we will have a correction (I trade in Australia).  In the week that started on 27th Apr we had the correction, the price of the Australian gold index went down to touch the 50 days MAV so I bought most of my trading positions back. Last week the price of XGD rallied back to where I sold and is now squeezed between the rising 16-20 echo and the down trend line that originated at Aug 2019 top. In my opinion, this chart shows much more unreleased energy than the USERX chart therefore has more potential to break out. A possible 16-20 index buy is decent protection against  92-96 sell as well as the 218-222 sell. In the case of a breakout, I would consider that the target is around 8700.00 (Aug 2019 peak).  The Australian shares have underperformed during the last few months so I think that this target is achievable even if the gold price is going sideways for two months as it seems is probable. 

daily


HUI
HUI is in a bullish posture, all indexes are in the right order. The price is squeezed in between short term uptrend and the 2016 high resistance so technically it still hasn't broken out but it is very close to doing so. There is a lot of space for a correction without any damage to the overall bullish picture. Strong support lies around 220-230. 

daily


XAU
XAU's chart is similar to the HUI's, it is bullish on all timeframes. The difference is that the XAU has already broken out and a correction or a sideways move would be quite desirable for a sustained bullish advance. 

GDX
GDX's chart presents the same picture as the XAU, it is bullish on all timeframes. The price has broken out and a correction or a sideways move would be quite desirable for a sustained bullish advance. 


GDXJ
GDXJ chart is similar to USERX. The price is on the double buy but still bellow the pre-crash top price and the 2016 top price. A correction would sell the 92-96 buy signal but would also set the stage for a true bull market buy. I prefer correction. 


SLV
SLV is lagging at this stage and it has a lot of space to cover. It has bought the 35-39 and the 16-20 for a double buy which should help to overcome the major resistance represented by the 218-222 index. Currently, the 200 days MAV lays around 15.80 and that should be considered the immediate target. If the price turns down the support should be around 13-13.5.

S and P 500
SandP has recovered 61.8% of the losses incurred during the crash. Both 100 days MAV and 200 days MAV, as well as the 2019 and 2018 tops, are creating resistance at around 3000.0. So far the 218-222 index has been a firm resistance too and also at the same 3000.0 level. I think the S and P is rolling over and if it goes into a dive it will take the gold market with it at least initially. If in an unlikely event it manages to break through such a tough resistance the move towards the 92-96 resistance around 3200-3300 should be quite swift. Such an event would help gold to overcome the 1750 resistance and try to pass 1800 and beyond. 

daily


TLT - Bonds
TLT is on a double buy since the end of January. This buy hasn't been threatened even during the crash. The after crash recovery has been stopped at the pre-crash high but last FRI price generated a new 16-20 buy which should mark the short term low and help to try a breakout from the symmetrical triangle which is restricting the advance at the moment. 

UUP - Dollar
UUP has gone nowhere since Aug 2019. It is currently on a true bull signal which has also gone nowhere for 24 days since inception. The squeeze is becoming tighter and tighter and when this chart moves it should be very quick. I said before that I think that the answer to the inflation/deflation discussion lies in this chart. I am presenting the weekly chart too to illustrate that in the case of a breakout the long term target is 25% above the current level! I am seriously considering going long dollar for 8 to 12 months if the upcoming 35-39 sell buys back at 28.0 or higher.

UUP weekly - gigantic inverse HandS


Bitcoin
BTC has done everything needed to start turning the chart bullish. It has rallied 35% since it generated the 35-39 bull signal and now it needs just a little push to buy the 92-96 and completely turns the picture upside down. Bitcoin has been the best performing asset for the last 4 weeks. I had hoped that I could see something like this from the SLV but it didn't happen. Personally, I had not been involved with bitcoin in the past and in the last few months I am trying to figure it out but it evades me, I cannot understand it. It seems like it is moving in synch with the S and P recently and I suspect it could be susceptible to a downturn in the GM. 

weekly


I am 100% long since Fri 1st May. I am not convinced that the breakout is the next move that we are going to see in the gold market so I will be a keen seller of my trading position at the next resistance. I manage these levels individually for each of my shares. My general stop loss level is still the USERX 218-222 sell. If the dollar breaks out I will consider taking a long position.

Good luck to all,
Branko


Sunday, 26 April 2020

USERX Double buy true bull signal - under the hood

Last week I was expecting some weakness in gold and GM markets and possible decoupling between them. I wasn't sure how much of a correction should I expect and it turned out that there wasn't much of a correction at all. The only weakness was exhibited during the Tuesday session and for the rest of the weak, the prices rallied strongly in the gold market and went sideways in the GM. I was ready to buy a full position in the gold shares but most of my bids hadn't been filled. The end of the week was marked with the strong double buy for a true bull signal in the goldies. I'll try to present the technical side of the current market the way I see it.

USERX
USERX held for two days around 8.80, long enough to sell the 92-96 echo and then exploded up to buy simultaneously the 35-39 and the 92-96 echo for a true bull double buy. Last week I said "The current action is how impulse legs look like in bull markets. The only thing that is now missing is a quick sell and a rebuy for a true bull... The most bullish pattern would be to finish the V bottom recovery by price rising back above the 35-39 echo at around 9.54 and stay there for a while before attacking the high at 10.61." This is exactly what happened and while I still stand behind the statement that this unfolded action was the most bullish possible I honestly thought that the other scenario was more probable because the current pattern would be too good and required 'threading the needle' which we usually don't get in these markets. I also had some thoughts on why I wouldn't like this scenario but I didn't write them down so let's do it now. What I do not like about this signal?

First, it is happening below the resistance line marked by the 2016 high which was proven to be too strong to overcome three times so far. I would have preferred the signal to have marked the breakout above this level. The strongest SKI signals are those that are corroborated by the traditional TA.

Second, the signal is happening while the major 92-96 echo is on the rise. The best 92-96 buys normally have a different structure; after the signal the price goes up and the index goes down. This means the signal comes after a long period of declining prices to form this typical bullish picture. The current picture is the one that is more typical for the tops; after the signal both the price and the index are going up making it more difficult for the price to stay above the back prices. The end of long rallies are usually marked with one or two fake signals like this one might be (I am not saying it is) and like the previous one was.

Third, from the psychological point of view, this setup is easier to trade because it has a tight stop, unlike a one where the price and index would go opposite ways. I feel that most traders are really keen on taking this trade on as opposed to a difficult proper bull structure where the stop loss would be far away and for that reason riskier to trade; traders are usually uncomfortable with these.  None of the true bull setups from the past that ended up as big winners had this current type of setup.

Fourth reason would be contextual. I was expecting decoupling of GMs and goldies because that would guarantee the absence of the downward pressure on gold in the case of a renewed fall in the share market, which is expected and probable. It didn't happen, the GMs are potentially rolling over but not in a convincing way, at the same time the goldies are rallying and that could be interpreted as decoupling but what would really convince me is if I saw them first falling together and then separating.

What would really help to mitigate most of these weaknesses is if the current rally continues for at least two more days to bring the price close or above the recent high at 10.61. I assume that for this to happen gold should break above the 1730.00 level and move closer to 1800.00 where I would be happy to reduce my position again and wait for the correction.

Let's see now what I do like about this setup.

First, it is a simultaneous double buy. The only formation stronger than this would be a simultaneous triple buy, therefore technically this is a very potent signal.

Second. I have started doing these SKI signals analysis based on the hypothesis that the most successful SKI signals happen simultaneously on various indices. All good signals in the last 20 years were like that. This double buy signal with all its technical weaknesses is happening while most of the other indices are in similar structural position but without the faults of the USERX signal. For example, gold is above its previous high it is on a true bull signal and on its way to test the all-time high.  HUI, XAU and GDX are all above the recent high and far above the 92-96 echo to be immediately worried about hitting stop loss. That makes the weaknesses of the USERX unconfirmed while the structure seems sound.

Third. As I explained before, the structure of this signal is more consistent with the end of a prolonged bull market than with the beginning of one. Having said that we could notice that the bull market preceding this signal wasn't a typical bull market regarding the size and the time. As you can remember the bull market generated in June 2019 was first cut short when compared to average successful bull signals and then it was followed by the bull market signal with the biggest drawdown in history. These two signals didn't really leave an exhausted price level to be worried about. There should be much more energy left in the gold and gold stocks to be able to stage a strong rally.

Fourth. Since the year 2000, the fundamentals for the gold bull market have never been better. Similar fundamentals, on a much lower scale, after the 2008 crash have made the gold stocks double up in the next twelve months. I sure expect much bigger gains this time around.

Fifth. In my blog from the 13th Apr in my long term SKI analysis, I established that the 218-222 echo is the border between the bull and the bear territory and that the main resistance is the 881-885 echo. This last leg up has broken through the 881-885 echo which means that the long term resistance has now been overcome.
regular
long term


This last week I succeded to add some gold shares to my trading position but because of a weak correction, it wasn't even close to what I wanted. The most shares I added were PRU but I couldn't get a decent price for the SLR which I wanted the most. I am 80% long mainly physical gold and silver.  Because I consider the 218-221 echo the border between the bull and the bear territory and because I am trying to establish a long term position I will use this echo as the stop loss, not the 92-96.

Good luck to all,
Branko


Sunday, 19 April 2020

Quick Update

I sold my trading positions on Thursday before the Easter holidays in the expectation that we will have a week or two of a correction.  For most of the gold indices, Monday 13th after the holiday was a big up day into the 16-20 sell execution day. The rest of the week prices rolled over and the Friday finally was a nice down day. The general market didn't stop at the 16-20 sell and made a new high by the end of the week. I think the rally in the GM was all news related and the GM is going to follow the gold soon. The question is how much of a correction is in the cards for the gold market and how much for the GMs. Looking at the crash of 2008 my expectation is for the gold market to decouple from the GM in the weeks to come. Back in 2008, they decoupled after this next bottom that we expect in the near future.


USERX
Unlike in 2008, the USERX recovery from the crash bottom took the V shape form. The price shot straight through the 16-20 sell and went up to buy a 92-96 echo. The process took 15 days while in 2008 it took 5 months for the buy to realise. The current action is how impulse legs look like in bull markets. The only thing that is now missing is a quick sell and a rebuy for a true bull. For this to happen the correction shouldn't be too deep and too long because after a deep correction it would be difficult to catch up with the rising 92-96 echo. The most bullish pattern would be to finish the V bottom recovery by price rising back above the 35-39 echo at around 9.54 and stay there for a while before attacking the high at 10.61.
If this doesn't happen the next viable scenario is more in line with the 2008 crash. The price gets pushed down with the GM correction deeper than most traders expect (a touch of 218-222?) and the next signal is a 35-39 buy like in 2008. After that, a slow rise would ensue until the 92-96 buy at around 9.5-10.0 by the end of June-July.
I am not seriously considering the possibility of another meltdown. We'll see how smart is that.


GLD
GLD is on a true bull signal, it took out the recent high, it is above 50mav and 200mav and above the uptrend line. That is bullish, very bullish.
The target for the correction is a touch of 35-39 at around 154.00 but is not necessary. In cash gold terms that would be around $1630.00. On the upside, the target is the all-time high at 184.


HUI
HUI's chart looks like what I would like to see the USERX chart to look like in a week time. It has completed the V shape recovery and is now on the brink of breaking the pre-crash high. If it does this the next target is the 2016 high at 286.05. There is quite strong support underneath represented by the 35-39 echo and the uptrend line.


XAU
XAU looks more like the HUI than like the USERX. The difference is, if it clears the recent high it will also break the 2016 high and enter the acceleration zone with the next target at 140.94, the 2013 breakdown level.


GDX
Same as the XAU. If it breaks out the next target is 39.08


GDXJ
GDXJ setup is more similar to USERX than GDX. Next targets are 52.5 (2016 top) and 69.48 respectively (2013 breakdown).


XGD - Australian gold index
XGD bought the 92-96 for a potential bull market. The most probable next signal is a 35-39 buy which would make a double buy with the existing 92-96. Keeping the price above 7000ish will buy the 35-39 in the next 5 days.


SLV
SLV is lagging and that is normal in the beginning of a bull market. If the gold run continues we should expect silver to catch up in a pretty spectacular fashion.


S and P 500
S and P sold the 16-20 and bough 218-222 echo. The 16-20 didn't stop the rally but the 218-222 might. I actually expect this to happen. If it doesn't $2950.00 should be a very firm resistance and at that level I will establish a short position.


TLT
TLT is in a bullish constellation and ready to breakout.


UUP
UUP is still stuck in the no mans land. After triple whipsaw, it seemed like it has broken out last week but again it turned down and almost sold the 9 days old true bull signal. The sale has been missed by 1 day but the price is still really tightly squeezed in between the uptrend + 92-96 echo and the 2008 high + 16-20 echo. This chart should solve the inflation-deflation argument for the foreseeable future.


BTC - bitcoin
Some positive development here but nothing major. BTC bought the 35-39 but that buy is xxed. The good thing is that a drawdown would buy the 16-20 for a true buy so there is some support entering the picture.


Inflation
Inflation is still not showing up in the chart of inflation expectations. For now, there is no evidence to support the gold rally in this chart.


I am 70% long mostly physical gold and silver looking to start buying position in gold stocks. No stop loss on my physical.

Good luck to all,
Branko

Monday, 13 April 2020

Is gold breaking out?

This week I tried to refresh my long term views of the major gold indices. Based on the 2008 crash analogy I think that the first and the worst part of the ongoing crash has concluded. We should now enter a weak period that should end in decoupling of the gold market and the general market, gold to new highs GM to new lows. Secondary lows should be formed in the next two-four weeks.

USERX
USERX crossed the 16-20 index to trigger a sell signal. This was my preferred price action in the last week blog because it puts the USERX in a quite comfortable position. Underneath the current price, there is the 16-20 index and 218-222 index that should represent strong support. On the other side, there are 35-39 and 92-96 indices with possible buy signals. These possible buys represent a resistance but can be overcome in time and change into true bull setups. I personally would prefer some weakness this coming week to prepare for a sustainable advance to overhead resistance.

Let's revisit the long term traditional TA chart of USERX to see how this recent action fits into a wider context. In my blog from 13th Oct 2019, I showed the weekly USERX chart and suggested that in the long term it is painting a gigantic shallow pan formation and the breakout from the 2013 breakdown level would be marked with the rise over 10.28. I also stated that my initial target for the ongoing bull would be to hit/touch that level. Fast forward 6 months and what can we see? The price did rise to breach 10.28 and then expressly, in three weeks, broke down all the way back to the long term major support at 6.00 but that level held, the same like it did 8 times in the last 7 years. In the next three weeks, the price had risen back above 8.12 which I consider a bullish development. 50 and 21 week MAV are still above and will serve as resistance but more likely to break than the 7.8-8.1 area which, given the last 7 years history and the recent action, will serve as a very firm support. USERX still needs to go over 10.28 to enter a clear bull territory.
Based on this chart I would like to see the test of 7.8-8.12 area before the further rise continues.

Let's show USERX long term SKI as well. The 218-222 index clearly acted as a support in a similar fashion that the 881-885 did in the 2008 crash. Based on this action it is fair to say that for now, the 218-222 is the border between the bull and the bear territory.
One more thing is visible from this chart. The top was marked with the 881-885 sell signal so breaking above this index is crucial for the bull case. The 218-222 is rising support and the 881-885 is falling resistance, they cross in the middle of May and by that time we will have the verdict regarding the character of this market. Notice how the 660-664 is currently at 7.80 level and will serve as support reinforcing the bull case. The 660-664 gives support at the same level as the above weekly chart, therefore, corroborating the weekly chart analysis.


GLD
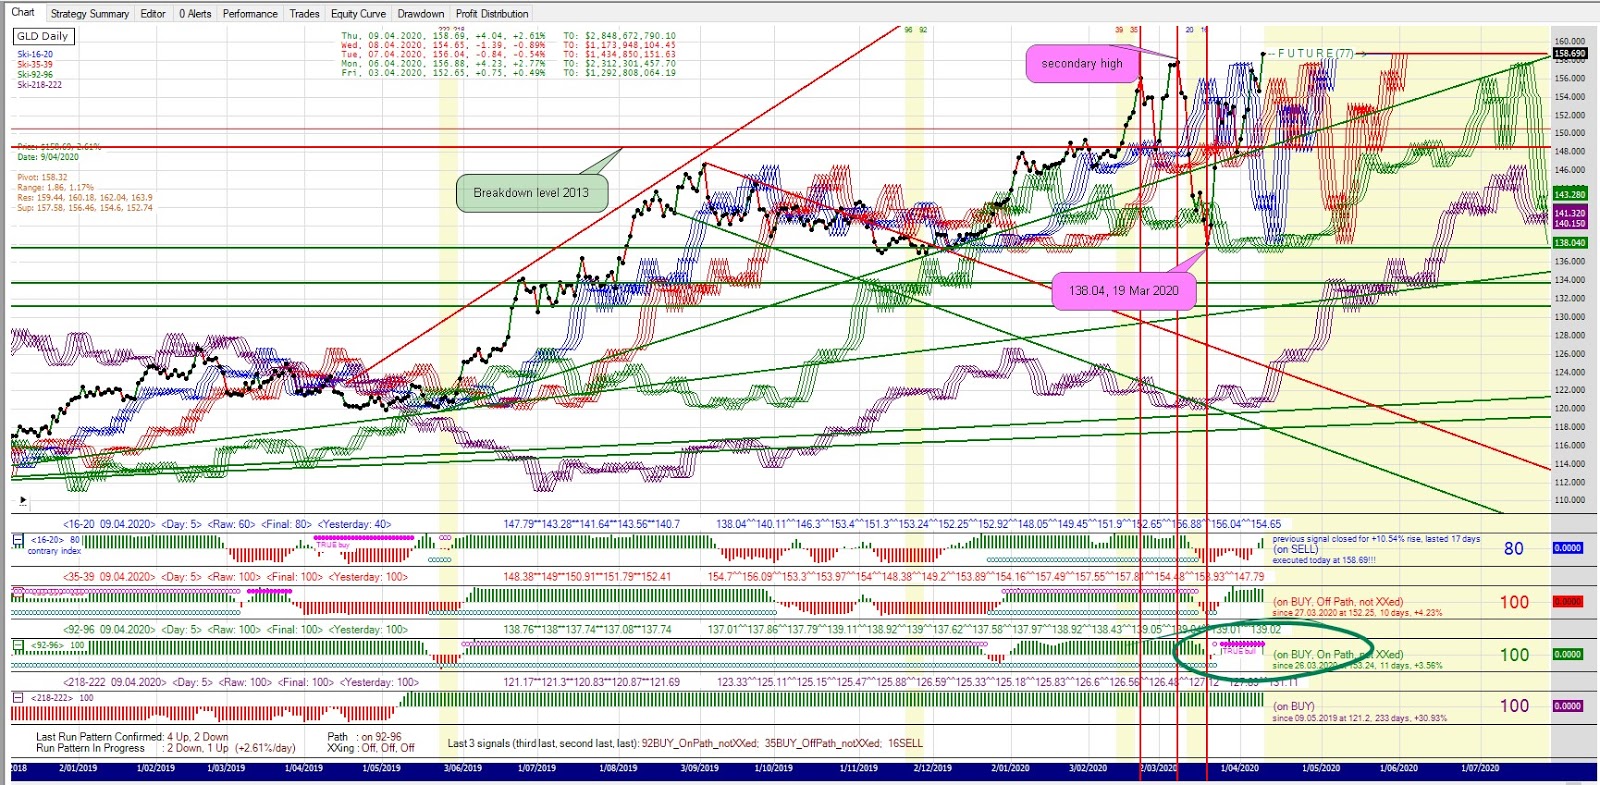
GLD is on a true bull signal, it executed its sell 16-20 signal and closed above the recent high. This is the breakout scenario from my last blog. Too much of a correction here is not desirable because it could cause a double sell with the 35-39 index. Even if that happens there is still a very good chance that it all leads to an immediate double buy which would be super bullish especially because it is all happening above the uptrend line, above the 2013 breakdown level and above the recent high while on a true bull signal.  This chart looks really bullish.

Let's also have a look at the GLD long term traditional TA chart. Similar to USERX the GLD is exhibiting a shallow pan formation that started at the 2013 breakdown at around 148. In February this year, the price had pushed up through the 2013 breakdown level but then, during the crash, fell back bellow, tested the 50-week mav and then rose above it again and closed at the new high for the year. The price wasn't this high since April 2013. I see this as a very positive development. I wouldn't be surprised to see the gold price at 1820.00 very soon. The first line of support on this chart is 150.95.

On the long term SKI chart, the GLD price is far above any of the long term indices. Even the crash didn't bring it close to any of them. The trend is clear and tested.


UUP
As I said last time the UUP chart is one exhibiting multiple whipsaws and very hard to interpret in the recent six months. Since last week the price weakened again and is now sitting below 2008 high again which proved to be a very significant level. UUP is on the true bull buy signal but it could easily sell if the price keeps weakening. The good news is the price is boxed in between the 92-96 index and the 2008 top and the new trend will reveal itself very soon. I think this chart will solve the inflation-deflation argument.

TLT
TLT is in an uptrend and clearly bullish.

XGD Australia
Australian gold index executed its 16-20 sell signal and is close to buying the 92-96. The 92-96 buy would be xxed but a quick dip bellow 6400 in the next week or two would create an instant sell and set up the stage for a true bull buy.
It has been more than 2 years that the Australian gold index is a leading indicator for the USA market so it would be really nice to see this 92-95 index buy happening. Currently, I am out of the stocks in my trading position but if this bull buy happens I will buy a full position.


HUI
HUI executed the 16-20 sell signal and is about to buy an xxed out 92-96. The 92-96 buy could transform into a true bull market if the price dipped below 220 for a quick sell and rebuy.


XAU
Same as HUI


GDX
Same as HUI


GDXJ
GDXJ needs to show more strength before it would be able to buy the 92-96. It sold the 16-20 today. I do not like this relative weakness of the GDXJ compared to the GDX. In the early stages of a gold bull market, junior miners should lead not lag. I suppose this is due to the liquidity crunch which affects explorers more than established producers.


SLV
SLV is lagging gold but it is normal in the early stages of a bull market in gold.


S and P 500
S and P executed its 16-20 sell signal. Probably it is time to go short on this one.


Bitcoin
There is a long way to go before we can say anything positive about this chart


At the close of the day before the holidays I sold all my gold shares that I acquired in the week before and now owe only gold and silver again. I am 70% long and will wait for weakness or for a clear breakout to repurchase my position again.
For my physical position, I do not keep stop loss, it is a long term investment.

Good luck to everyone.

Branko